In this blogpost we look at the recent concerns around MongoDB ransomware and security issues, and how to mitigate this threat to your own MongoDB instance.
Recently, various security blogs raised concern that a hacker is hijacking MongoDB instances and asking ransom for the data stored. It is not the first time unprotected MongoDB instances have been found vulnerable, and this stirred up the discussion around MongoDB security again.
What is the news about?
About two years ago, the university of Saarland in Germany alerted that they discovered around 40,000 MongoDB servers that were easily accessible on the internet. This meant anyone could open a connection to a MongoDB server via the internet. How did this happen?
Default binding
In the past, the MongoDB daemon bound itself to any interface. This means anyone who has access to any of the interfaces on the host where MongoDB is installed, will be able to connect to MongoDB. If the server is directly connected to a public ip address on one of these interfaces, it may be vulnerable.
Default ports
By default, MongoDB will bind to standard ports: 27017 for MongoDB replicaSets or Shard Routers, 27018 for shards and 27019 for Configservers. By scanning a network for these ports it becomes predictable if a host is running MongoDB.
Authentication
By default, MongoDB configures itself without any form of authentication enabled. This means MongoDB will not prompt for a username and password, and anyone connecting to MongoDB will be able to read and write data. Since MongoDB 2.0 authentication has been part of the product, but never has been part of the default configuration.
Authorization
Part of enabling authorization is the ability to define roles. Without authentication enabled, there will also be no authorization. This means anyone connecting to a MongoDB server without authentication enabled, will have administrative privileges too. Administrative privileges stretches from defining users to configuring MongoDB runtime.
Why is all this an issue now?
In December 2016 a hacker exploited these vulnerabilities for personal enrichment. The hacker steals and removes your data, and leaves the following message in the WARNING collection:
{"_id" : ObjectId("5859a0370b8e49f123fcc7da"),"mail" : "harak1r1@sigaint.org","note" : "SEND 0.2 BTC TO THIS ADDRESS 13zaxGVjj9MNc2jyvDRhLyYpkCh323MsMq AND CONTACT THIS EMAIL WITH YOUR IP OF YOUR SERVER TO RECOVER YOUR DATABASE !"
}
Demanding 0.2 bitcoins (around $200 at this moment of writing) may not sound like a lot if you really want your data back. However in the meanwhile your website/application is not able to function normally and may be defaced, and this could potentially cost way more than the 0.2 bitcoins.
A MongoDB server is vulnerable when it has a combination of the following:
Bound to a public interface
Bound to a default port
No (or weak) authentication enabled
No firewall rules or security groups in place
The default port could be debatable. Any port scanner would also be able to identify MongoDB if it was placed under an obscured port number.
The combination of all four factors means any attacker may be able to connect to the host. Without authentication (and authorization) the attacker can do anything with the MongoDB instance. And even if authentication has been enabled on the MongoDB host, it could still be vulnerable.
Using a network port scanner (e.g. nmap) would reveal the MongoDB build info to the attacker. This means he/she is able to find potential (zero-day) exploits for your specific version, and still manage to compromise your setup. Also weak passwords (e.g. admin/admin) could pose a threat, as the attacker would have an easy point of entry.
How can you protect yourself against this threat?
There are various precautions you can take:
Put firewall rules or security groups in place
Bind MongoDB only to necessary interfaces and ports
Enable authentication, users and roles
Backup often
Security audits
For new deployments performed from ClusterControl, we enable authentication by default, create a separate administrator user and allow to have MongoDB listen on a different port than the default. The only part ClusterControl can’t setup, is whether the MongoDB instance is available from outside your network.
ClusterControl
Single Console for Your Entire Database Infrastructure
Deploy, manage, monitor, scale your databases on the technology stack of your choice!
The first step to secure your MongoDB server, would be to place firewall rules or security groups in place. These will ensure only the client hosts/applications necessary will be able to connect to MongoDB. Also make sure MongoDB only binds to the interfaces that are really necessary in the mongod.conf:
Enabling authentication and setting up users and roles would be the second step. MongoDB has an easy to follow tutorial for enabling authentication and setting up your admin user. Keep in mind that users and passwords are still the weakest link in the chain, and ensure to make those secure!
After securing, you should ensure to always have a backup of your data. Even if the hacker manages to hijack your data, with a backup and big enough oplog you would be able to perform a point-in-time restore. Scheduling (shard consistent) backups can easily be setup in our database clustering, management and automation software called ClusterControl.
Perform security audits often: scan for any open ports from outside your hosting environment. Verify that authentication has been enabled for MongoDB, and ensure the users don’t have weak passwords and/or excessive roles. For ClusterControl we have developed two advisors that will verify all this. ClusterControl advisors are open source, and the advisors can be run for free using ClusterControl community edition.
Will this be enough to protect myself against any threat?
With all these precautions in place, you will be protected against any direct threat from the internet. However keep in mind that any machine compromised in your hosting environment may still become a stepping stone to your now protected MongoDB servers. Be sure to upgrade MongoDB to the latest (patch) releases and be protected against any threat.
The MySQL database workload is determined by the number of queries that it processes. There are several situations in which MySQL slowness can originate. The first possibility is if there is any queries that are not using proper indexing. When a query cannot make use of an index, the MySQL server has to use more resources and time to process that query. By monitoring queries, you have the ability to pinpoint SQL code that is the root cause of a slowdown.
By default, MySQL provides several built-in tools to monitor queries, namely:
Slow Query Log - Captures query that exceeds a defined threshold, or query that does not use indexes.
General Query Log - Captures all queries happened in a MySQL server.
SHOW FULL PROCESSLIST statement (or through mysqladmin command) - Monitors live queries currently being processed by MySQL server.
PERFORMANCE_SCHEMA - Monitors MySQL Server execution at a low level.
There are also open-source tools out there that can achieve similar result like mtop and Percona’s pt-query-digest.
How ClusterControl monitors queries
ClusterControl does not only monitor your hosts and database instances, it also monitors your database queries. It gets the information in two different ways:
Queries are retrieved from PERFORMANCE_SCHEMA
If PERFORMANCE_SCHEMA is disabled or unavailable, ClusterControl will parse the content of the Slow Query Log
ClusterControl starts reading from the PERFORMANCE_SCHEMA tables immediately when the query monitor is enabled, and the following tables are used by ClusterControl to sample the queries:
In older versions of MySQL (5.5), having PERFORMANCE_SCHEMA (P_S) enabled might not be an option since it can cause significant performance degradation. With MySQL 5.6 the overhead is reduced and even more so in 5.7. P_S offers great introspection of the server at an overhead of a few percents (1-3%). If the overhead is a concern then ClusterControl can parse the Slow Query log remotely to sample queries. Note that no agents are required on your database servers. It uses the following flow:
Start slow log (during MySQL runtime).
Run it for a short period of time (a second or couple of seconds).
Stop log.
Parse log.
Truncate log (ClusterControl creates new log file).
Go to 1.
As you can see, ClusterControl does the above trick when pulling and parsing the Slow Query log to overcome the problems with offsets. The drawback of this method is that the continuous sampling might miss some queries during steps 3 to 5. Hence, if continuous query sampling is vital for you and part of your monitoring policy, the best way is to use P_S. If enabled, ClusterControl will automatically use it.
The collected queries are hashed, calculated and digested (normalize, average, count, sort) and then stored in ClusterControl.
Enabling Query Monitoring
As mentioned earlier, ClusterControl monitors MySQL query via two ways:
Fetch the queries from PERFORMANCE_SCHEMA
Parse the content of MySQL Slow Query
Performance Schema (Recommended)
First of all, if you would like to use Performance Schema, turn it on all MySQL servers (MySQL/MariaDB v5.5.3 and later). Enabling this requires a MySQL restart. Add the following line to your MySQL configuration file:
performance_schema = ON
Then, restart the MySQL server. For ClusterControl users, you can use the configuration management feature at Manage -> Configurations -> Change Parameter and perform a rolling restart at Manage -> Upgrades -> Rolling Restart.
Once enabled, ensure at least events_statements_current is enabled:
mysql> SELECT * FROM performance_schema.setup_consumers WHERE NAME LIKE 'events_statements%';
+--------------------------------+---------+
| NAME                           | ENABLED |
+--------------------------------+---------+
| events_statements_current      | YES     |
| events_statements_history      | NO      |
| events_statements_history_long | NO      |
+--------------------------------+---------+
Otherwise, run the following statement to enable it:
UPDATE performance_schema.setup_consumers SET ENABLED = 'YES' WHERE NAME = 'events_statements_current';
MySQL Slow Query
If Performance Schema is disabled, ClusterControl will then default to the Slow Query log. Hence, you don’t have to do anything since it can be turned on and off dynamically during runtime via SET statement.
The Query Monitoring function must be toggled to on under ClusterControl -> Query Monitor -> Top Queries. ClusterControl will monitor queries on all database nodes under this cluster:
Image may be NSFW. Clik here to view.
Click on the “Settings” and configure “Long Query Time” and toggle “Log queries not using indexes” to On. If you have defined two parameters (long_query_time and log_queries_not_using_indexes) inside my.cnf and you would like to use those values instead, toggle “MySQL Local Query Override” to On. Otherwise, ClusterControl will obey the former.
Once enabled, you just need to wait a couple of minutes before you can see data under Top Queries and Query Histogram.
How ClusterControl visualizes the queries
Under the Query Monitor tab, you should see the following three items:
Top Queries
Running Queries
Query Histogram
We’ll have a quick look at these here, but remember that you can always find more details in the ClusterControl documentation.
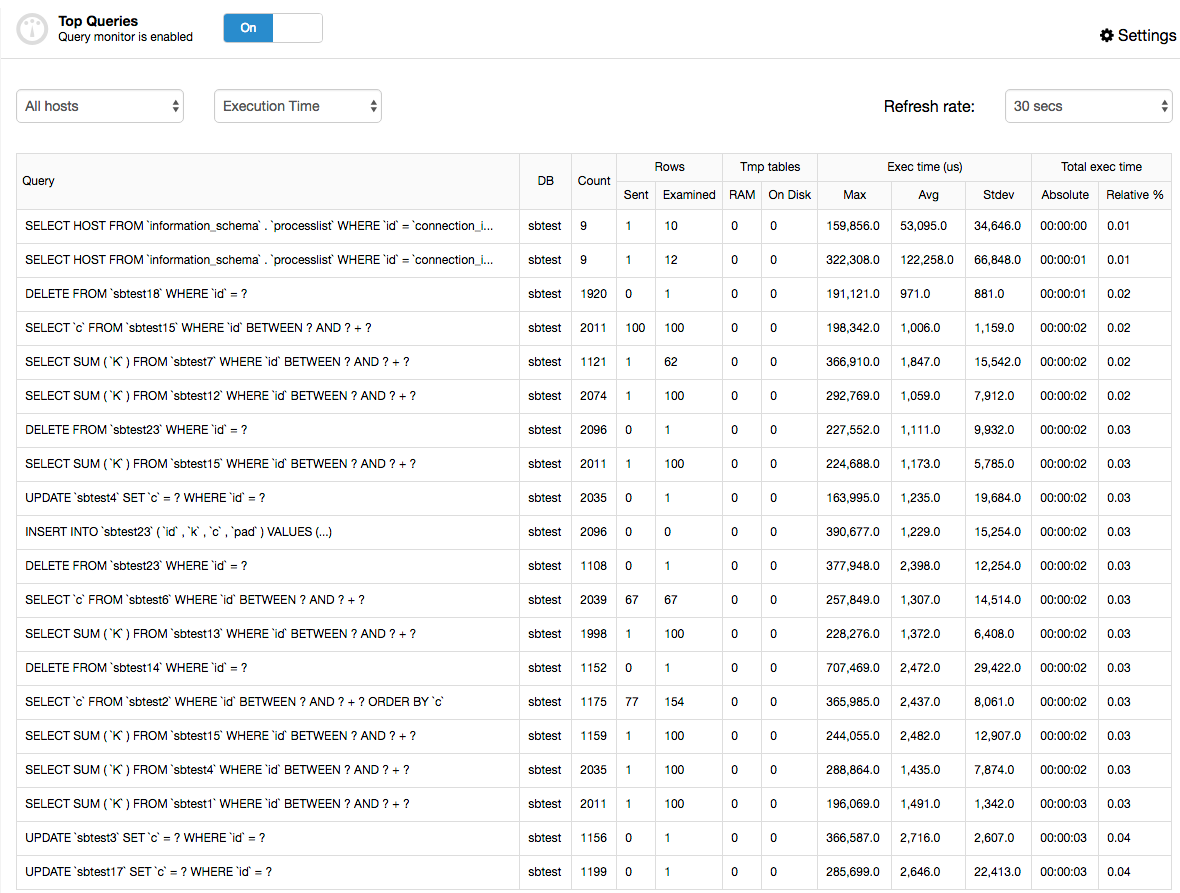
Top Queries
Top Queries is an aggregated list of all your top queries running on all the nodes of your cluster. The list can be ordered by “Occurrence” or “Execution Time”, to show the most common or slowest queries respectively. You don’t have to login to each of the servers to see the top queries. The UI provides an option to filter based on MySQL server.
If you are using the Slow Query log, only queries that exceed the “Long Query Time” will be listed here. If the data is not populated correctly and you believe that there should be something in there, it could be:
ClusterControl did not collect enough queries to summarize and populate data. Try to lower the “Long Query Time”.
You have configured Slow Query Log configuration options in the my.cnf of MySQL server, and “Override Local Query” is turned off. If you really want to use the value you defined inside my.cnf, probably you have to lower the long_query_time value so ClusterControl can calculate a more accurate result.
You have another ClusterControl node pulling the Slow Query log as well (in case you have a standby ClusterControl server). Only allow one ClusterControl server to do this job.
The “Long Query Time” value can be specified to a resolution of microseconds, for example 0.000001 (1 x 10⁻⁶). The following shows a screenshot of what’s under Top Queries:
Image may be NSFW. Clik here to view.
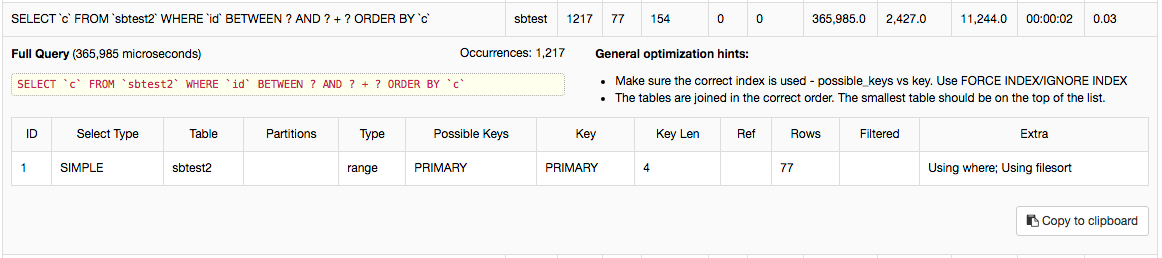
Clicking on each query will show the query plan executed, similar to EXPLAIN command output:
Image may be NSFW. Clik here to view.
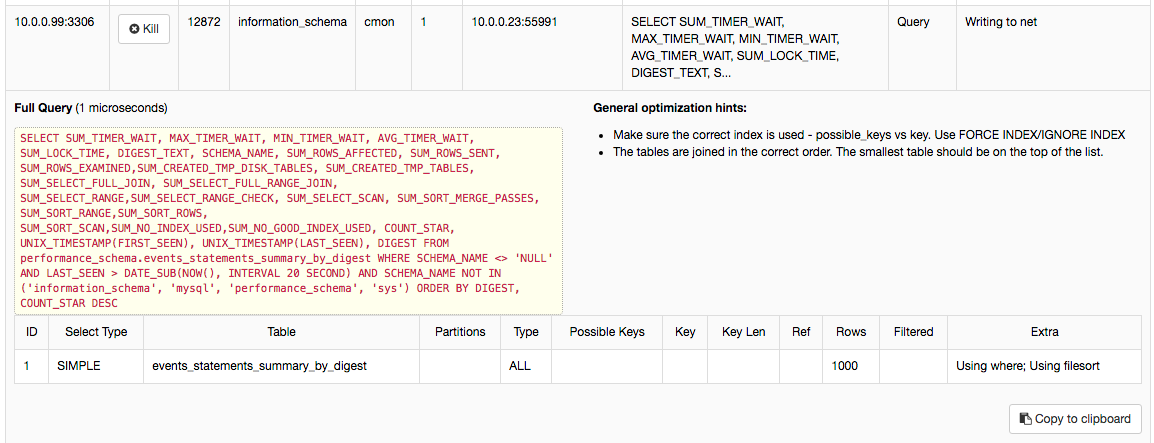
Running Queries
Running Queries provides an aggregated view of current running queries across all nodes in the cluster, similar to SHOW FULL PROCESSLIST command in MySQL. You can stop a running query by selecting to kill the connection that started the query. The process list can be filtered out by host.
Use this feature to monitor live queries currently running on MySQL servers. By clicking on each row that contains “Info”, you can see the extended information containing the full query statement and the query plan:
Image may be NSFW. Clik here to view.
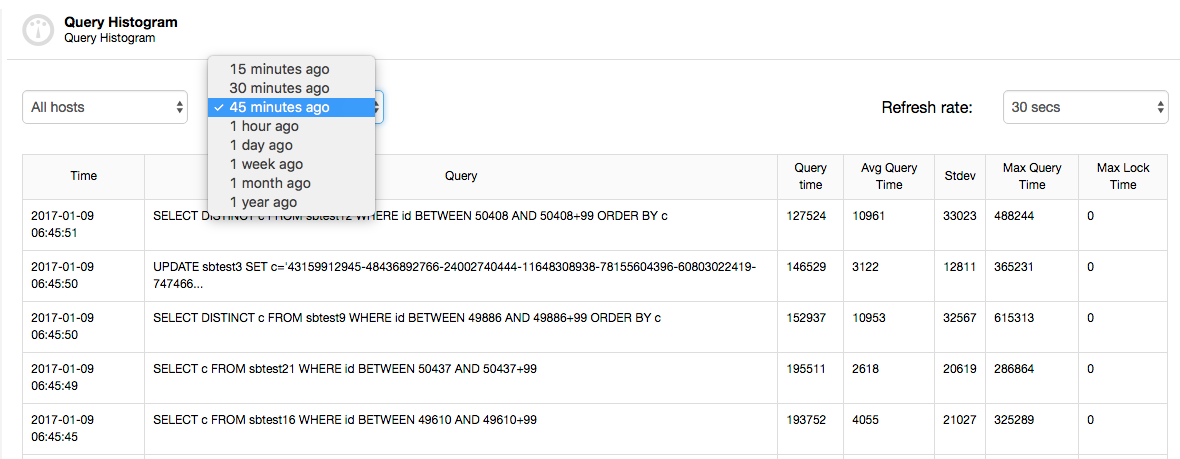
Query Histogram
The Query Histogram is actually showing you queries that are outliers. An outlier is a query taking longer time than the normal query of that type. Use this feature to filter out the outliers for a certain time period. This feature is dependent on the Top Queries feature above. If Query Monitoring is enabled and Top Queries are captured and populated, the Query Histogram will summarize these and provide a filter based on timestamp.
Image may be NSFW. Clik here to view.
That’s all folks! Monitoring queries is as important as monitoring your hosts or MySQL instances, to make sure your database is performing well.
Today we are pleased to announce the 1.4 release of ClusterControl - the all-inclusive database management system that lets you easily deploy, monitor, manage and scale highly available open source databases in any environment; on-premise or in the cloud.
This release contains key new features for MongoDB and MySQL Replication in particular, along with performance improvements and bug fixes.
Release Highlights
For MySQL
MySQL Replication
Enhanced multi-master deployment
Flexible topology management & error handling
Automated failover
MySQL Replication & Load Balancers
Deploy ProxySQL on MySQL Replication setups and monitor performance
HAProxy Read-Write split configuration support for MySQL Replication setups
Experimental support for Oracle MySQL Group Replication
ClusterControl 1.4 brings a number of new features to better support replication users. You are now able to deploy a multi-master replication setup in active - standby mode. One master will actively take writes, while the other one is ready to take over writes should the active master fail. From the UI, you can also easily add slaves under each master and reconfigure the topology by promoting new masters and failing over slaves.
Topology reconfigurations and master failovers are not usually possible in case of replication problems, for instance errant transactions. ClusterControl will check for issues before any failover or switchover happens. The admin can define whitelists and blacklists of which slaves to promote to master (and vice versa). This makes it easier for admins to manage their replication setups and make topology changes when needed.
Deploy ProxySQL on MySQL Replication clusters and monitor performance
Load balancers are an essential component in database high availability. With this new release, we have extended ClusterControl with the addition of ProxySQL, created for DBAs by René Cannaò, himself a DBA trying to solve issues when working with complex replication topologies. Users can now deploy ProxySQL on MySQL Replication clusters with ClusterControl and monitor its performance.
By default, ClusterControl deploys ProxySQL in read/write split mode - your read-only traffic will be sent to slaves while your writes will be sent to a writable master. ProxySQL will also work together with the new automatic failover mechanism. Once failover happens, ProxySQL will detect the new writable master and route writes to it. It all happens automatically, without any need for the user to take action.
MongoDB & sharded clusters
MongoDB is the rising star of the Open Source databases, and extending our support for this database has brought sharded clusters in addition to replica sets. This meant we had to retrieve more metrics to our monitoring, adding advisors and provide consistent backups for sharding. With this latest release, you can now convert a ReplicaSet cluster to a sharded cluster, add or remove shards from a sharded cluster as well as add Mongos/routers to a sharded cluster.
New Severalnines database advisors for MongoDB
Advisors are mini programs that provide advice on specific database issues and we’ve added three new advisors for MongoDB in this ClusterControl release. The first one calculates the replication window, the second watches over the replication window, and the third checks for un-sharded databases/collections. In addition to this we also added a generic disk advisor. The advisor verifies if any optimizations can be done, like noatime and noop I/O scheduling, on the data disk that is being used for storage.
There are a number of other features and improvements that we have not mentioned here. You can find all details in the ChangeLog.
We encourage you to test this latest release and provide us with your feedback. If you’d like a demo, feel free to request one.
Thank you for your ongoing support, and happy clustering!
With the recent release of ClusterControl 1.4.0, we added a bunch of new features to better support MySQL replication users. In this blog post, we’ll give you a quick overview of the new features.
Enhanced multi-master deployment
A simple master-slave replication setup is usually good enough in a lot of cases, but sometimes, you might need a more complex topology with multiple masters. With 1.4.0, ClusterControl can help provision such setups. You are now able to deploy a multi-master replication setup in active - standby mode. One of the masters will actively take writes, while the other one is ready to take over writes should the active master fail. You can also easily add slaves under each master, right from the UI.
Image may be NSFW. Clik here to view.
Enhanced flexibility in replication topology management
With support for multi-master setups comes improved support for managing replication topology changes. Do you want to re-slave a slave off the standby master? Do you want to create a replication chain, with an intermediate master in-between? Sure! You can use a new job for that: “Change Replication Master”. Just go to one of the nodes and pick that job (not only on the slaves, you can also change replication master for your current master, to create a multi-master setup). You’ll be presented with a dialog box in which you can pick the master from which to slave your node off. As of now, only GTID-enabled replication is supported, both Oracle and MariaDB implementations.
Image may be NSFW. Clik here to view.
Replication error handling
You may ask - what about issues like errant transactions which can be a serious problem for MySQL replication? Well, for starters, ClusterControl always set slaves in read_only mode so only a superuser can create an errant transaction. It still may happen, though. That’s why we added replication error handling in ClusterControl.
Errant transactions are common and they are handled separately - errant transactions are checked for before any failover or switchover happens. The user can then fix the problem before triggering a topology change once more. If, for some reason (like high availability, for example), a user wants to perform a failover anyway, no matter if it is safe or not, it can also be done by setting:
replication_stop_on_error=0
This is set in the cmon configuration file of the replication setup ( /etc/cmon.d/cmon_X.cnf, where X is the cluster ID of the replication setup). In such cases, failover will be performed even if there’s a possibility that replication will break.
To handle such cases, we added experimental support for slave rebuilding. If you enable replication_auto_rebuild_slave in the cmon configuration and if your slave is marked as down with the following error in MySQL:
Got fatal error 1236 from master when reading data from binary log: 'The slave is connecting using CHANGE MASTER TO MASTER_AUTO_POSITION = 1, but the master has purged binary logs containing GTIDs that the slave requires.'
ClusterControl will attempt to rebuild the slave using data from the master. Such a setting may be dangerous as the rebuilding process will induce an increased load on the master, it may also be that your dataset is very large and a regular rebuild is not an option - that’s why this behavior is disabled by default. Feel free to try it out, though and let us know what you think about it.
Automated failover
Handling replication errors is not enough to maintain high availability with MySQL replication - you need also to handle crashes of MySQL instances. Until now, ClusterControl alerted the user and let her perform a manual failover. With ClusterControl version 1.4.0 comes support for automated failover handling. It is enough to have cluster recovery enabled for your replication cluster and ClusterControl will try to recover your replication cluster in the best way possible. You must explicitly enable "Cluster Auto Recovery" in the UI in order for automatic failover to be activated.
Once a master failure is detected, ClusterControl starts to look for the most up-to-date slave available. Once it’s been found, ClusterControl checks the remaining slaves and looks for additional, missing transactions. If such transactions are found on some of the slaves, the master candidate is configured to replicate from each of those slaves and apply any missing transactions.
If, for any reason, you’d rather not wait for a master candidate to get all missing transactions (maybe because you are 100% sure there won’t be any), you can disable this step by enabling the replication_skip_apply_missing_txs setting in cmon configuration.
For MariaDB setups, the behavior is different - ClusterControl picks the most advanced slave and promotes it to become master.
Getting missing transactions is one thing. Applying them is another. ClusterControl, by default, does not fail over to a slave if the slave has not applied all missing transactions. You could lose data. Instead, it will wait indefinitely to allow slaves to catch up. Of course, if the master candidate becomes up to date, ClusterControl will failover immediately after. This behavior can be configured using replication_failover_wait_to_apply_timeout setting in the cmon configuration file. Default value (-1) prevents any failover if master candidate is lagging behind. If you’d like to execute failover anyway, you can set it to 0. You can also set a timeout in seconds, this is the amount of time that ClusterControl will wait for a master candidate to catch up before performing a failover.
Once a master candidate is brought up to date, it is promoted to master and the remaining slaves are slaved off it. The exact process differs depending on which host failed (the active or standby master in a multi-master setup) but the final outcome is that all slaves are again replicating from the working master. Combined with proxies such as HAProxy, ProxySQL or MaxScale, this lets you build an environment where a master failure is handled in an automated and transparent way.
Additional control over failover behavior is granted through replicaton_failover_whitelist and replicaton_failover_blacklist lists in the cmon configuration file. These let you configure a list of slaves which should be treated as a candidate list to become master, and a list of slaves which should not be promoted to master by ClusterControl. There are numerous reasons you may want to use those variables. Maybe you have some backup or OLAP/reporting slaves which are not suitable to become a master? Maybe some of your slaves use weaker hardware or maybe they are located in a different datacenter? In this case, you can avoid them from being promoted by adding those slaves to the replicaton_failover_blacklist variable.
Likewise, maybe you want to limit the number of slaves that are promotable to a particular set of hosts which are the closest to the current master? Or maybe you use master - master, active - passive setup and you want only your standby master to be considered for promotion? Then specify the IP’s of master candidates in the replicaton_failover_whitelist variable. Please keep in mind that a restart of cmon process will be required to reload such configuration. By executing cmon --help-config on the controller, you will get more detailed information about these (and other) parameters.
Finally, you might want to manually restore replication.If you do not want ClusterControl to perform any automated failover in your replication topology, you can disable cluster recovery from the ClusterControl UI.
So, there are lots of good stuff to try out here for MySQL replication users. Do give it a try, and let us know how we’re doing.
ClusterControl reduces complexity of managing your database infrastructure on premise or in the cloud, while adding support for new technologies; enabling you to truly automate mixed environments for next-level applications.
Since the launch of ClusterControl in 2012, we’ve experienced growth in new industries with customers who are benefiting from the advancements ClusterControl has to offer.
In addition to reaching new highs in ClusterControl demand, this past year we’ve doubled the size of our team allowing us to continue to provide even more improvements to ClusterControl.
Watch this short video to see where ClusterControl stands today.
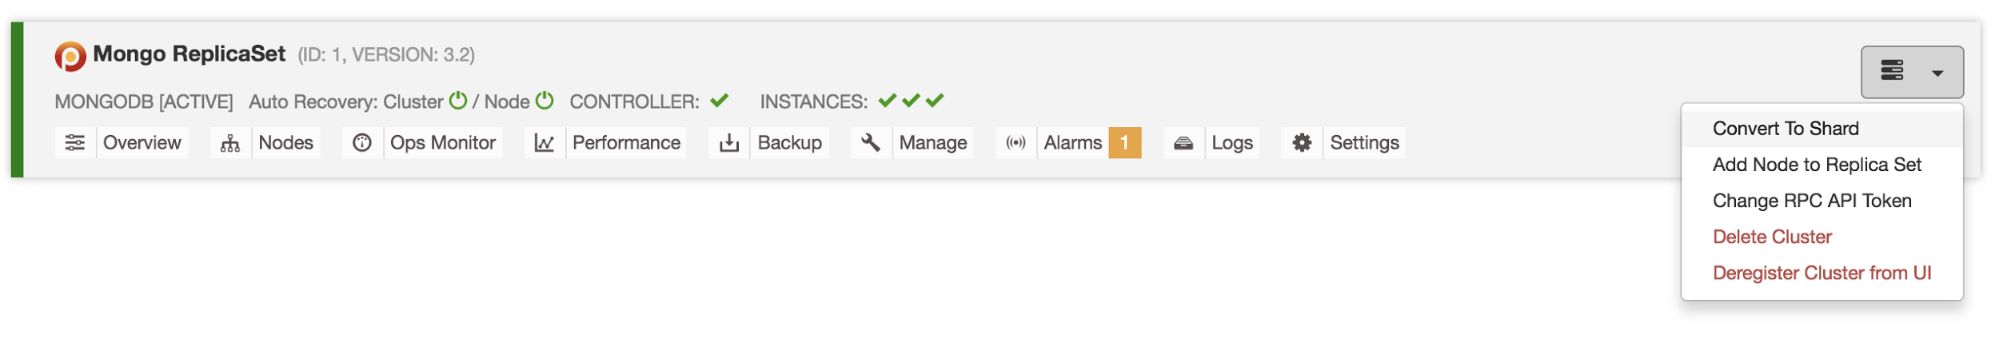
Our latest release of ClusterControl turns some of the most troublesome MongoDB tasks into a mere 15 second job. New features have been added to give you more control over your cluster and perform topology changes:
Convert a MongoDB replicaSet to a sharded MongoDB Cluster
Add and remove shards
Add shard routers to a sharded MongoDB cluster
Step down or freeze a node
New MongoDB advisors
We will describe these added features in depth below.
Convert a MongoDB replicaSet to a sharded MongoDB cluster
As most MongoDB users will start off with a replicaSet to store their database, this is the most frequently used type of cluster. If you happen to run into scaling issues you can scale this replicaSet by either adding more secondaries or scaling out by sharding. You can convert an existing replicaSet into a sharded cluster, however this is a long process where you could easily make errors. In ClusterControl we have automated this process, where we automatically add the Configservers, shard routers and enable sharding.
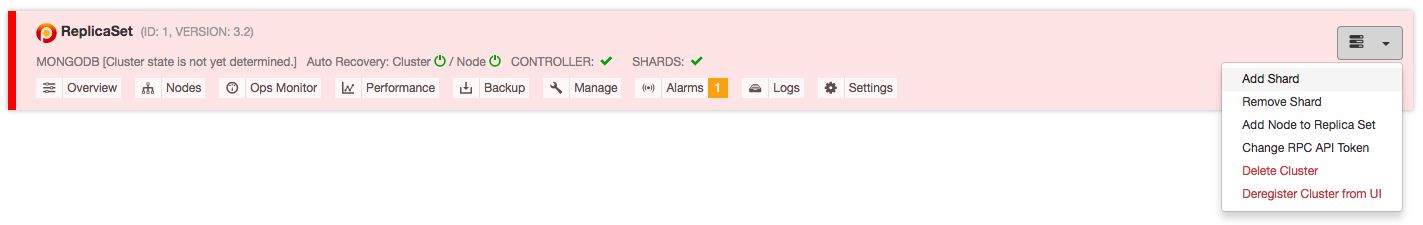
To convert a replicaSet into a sharded cluster, you can simply trigger it via the actions drop down:
Image may be NSFW. Clik here to view.
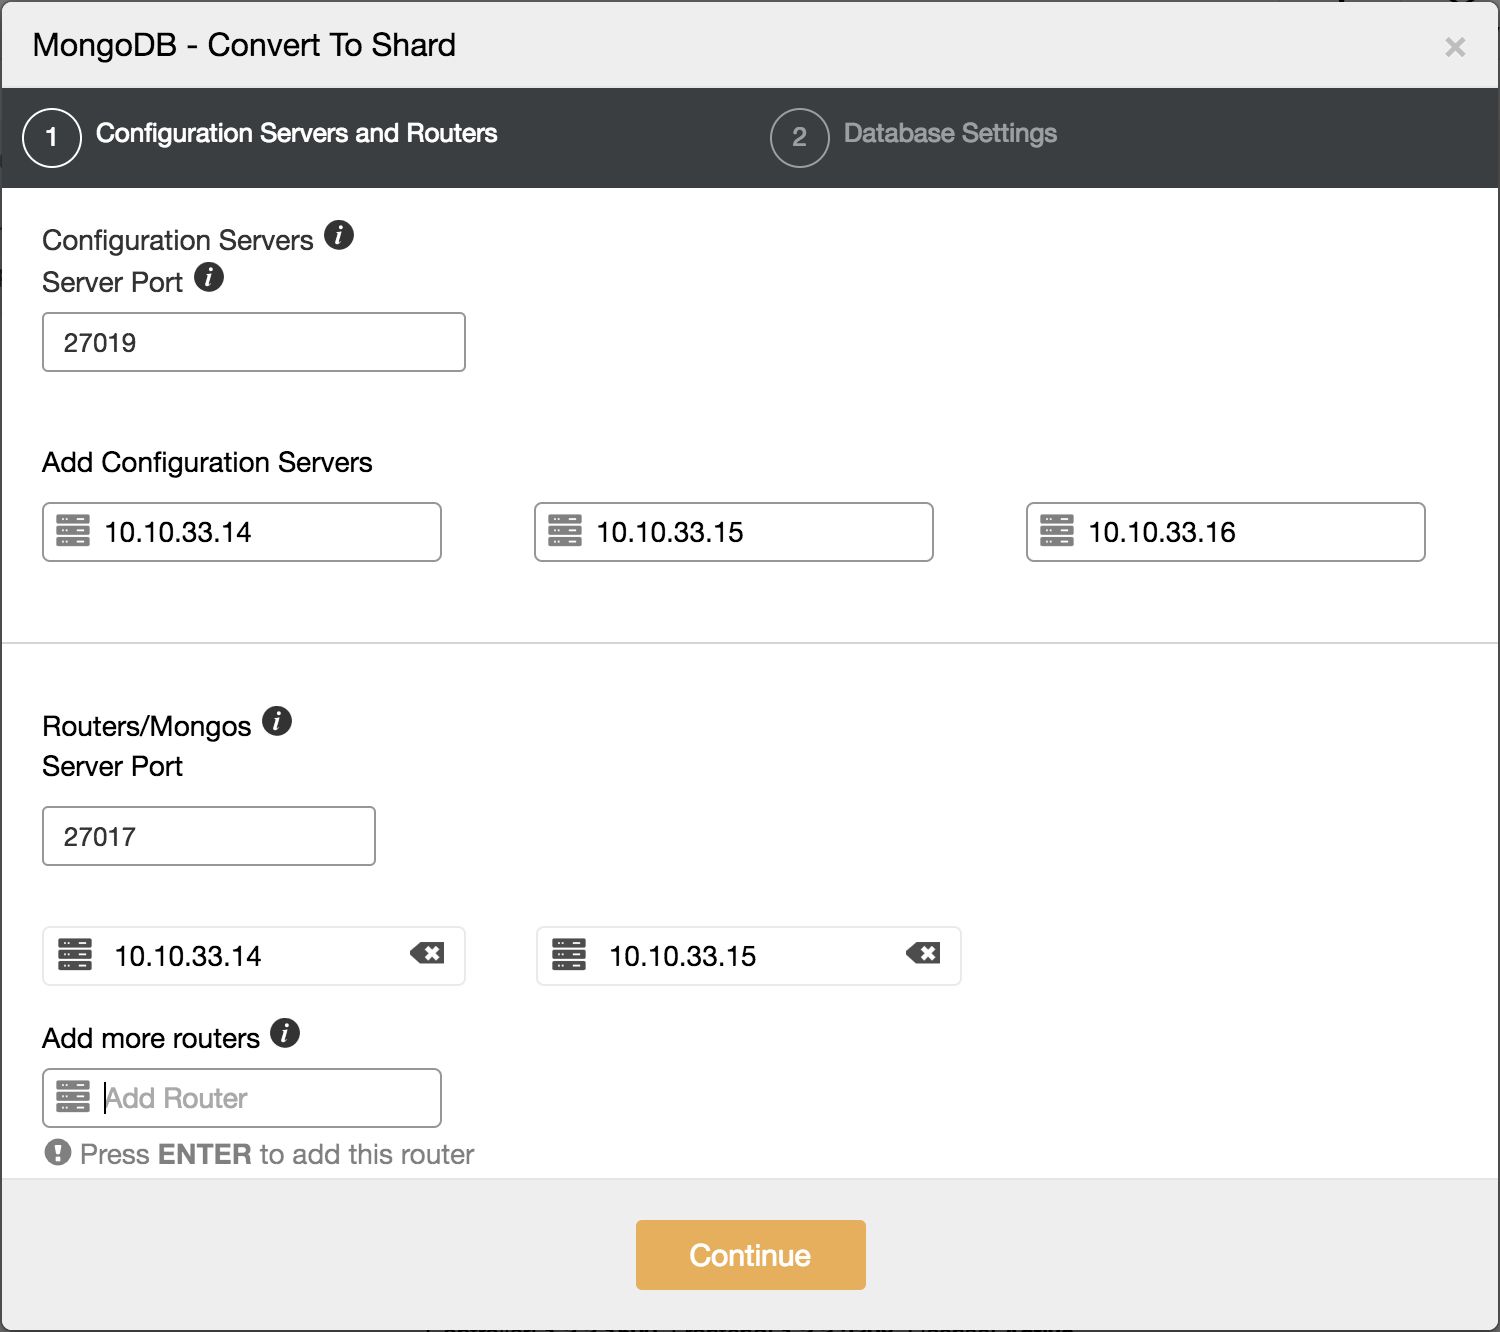
This will open up a two step dialogue on how to convert this into a shard. The first step is to define where to deploy the Configserver and shard routers to:
Image may be NSFW. Clik here to view.
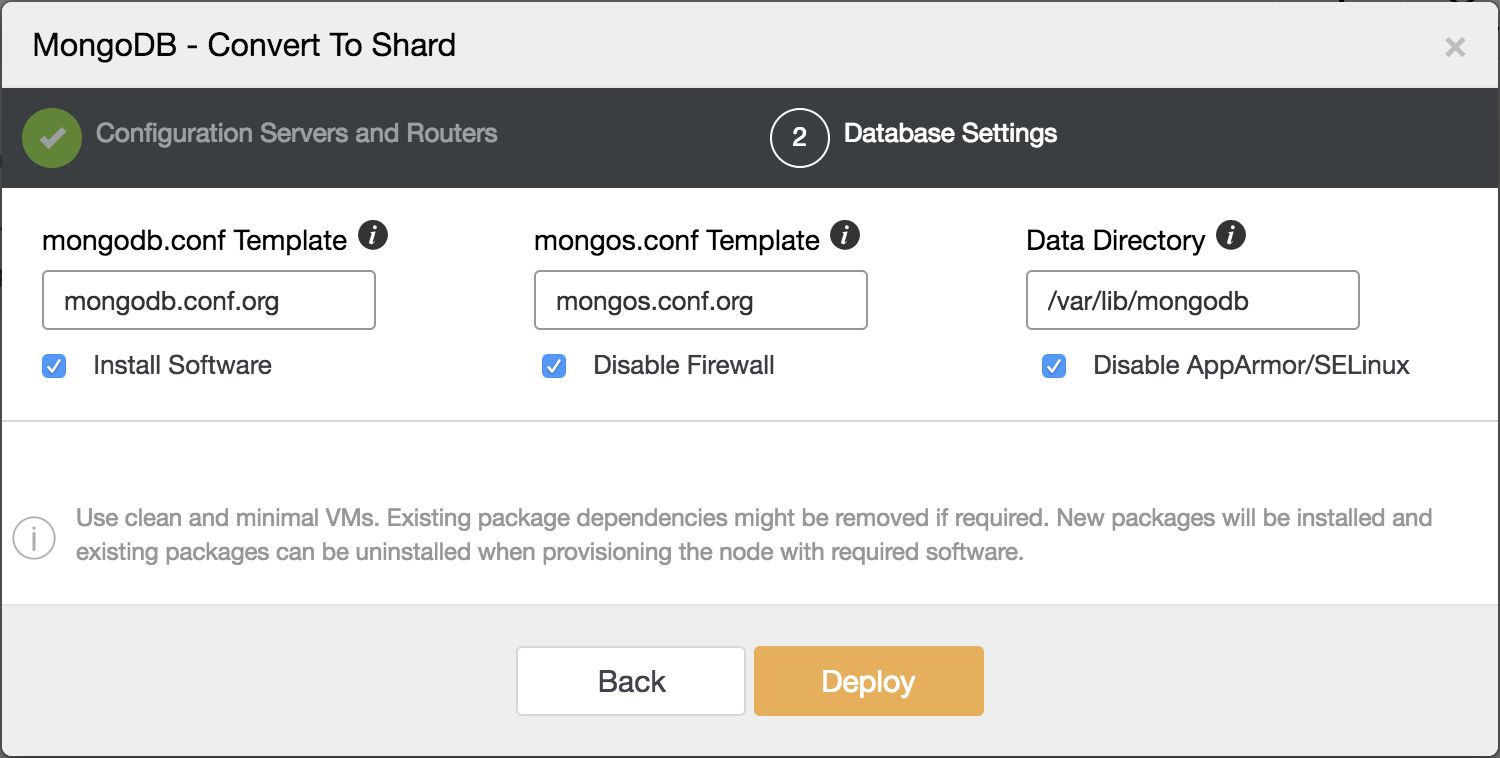
The second step is where to store the data and which config files should be used for the Configserver and shard router.
Image may be NSFW. Clik here to view.
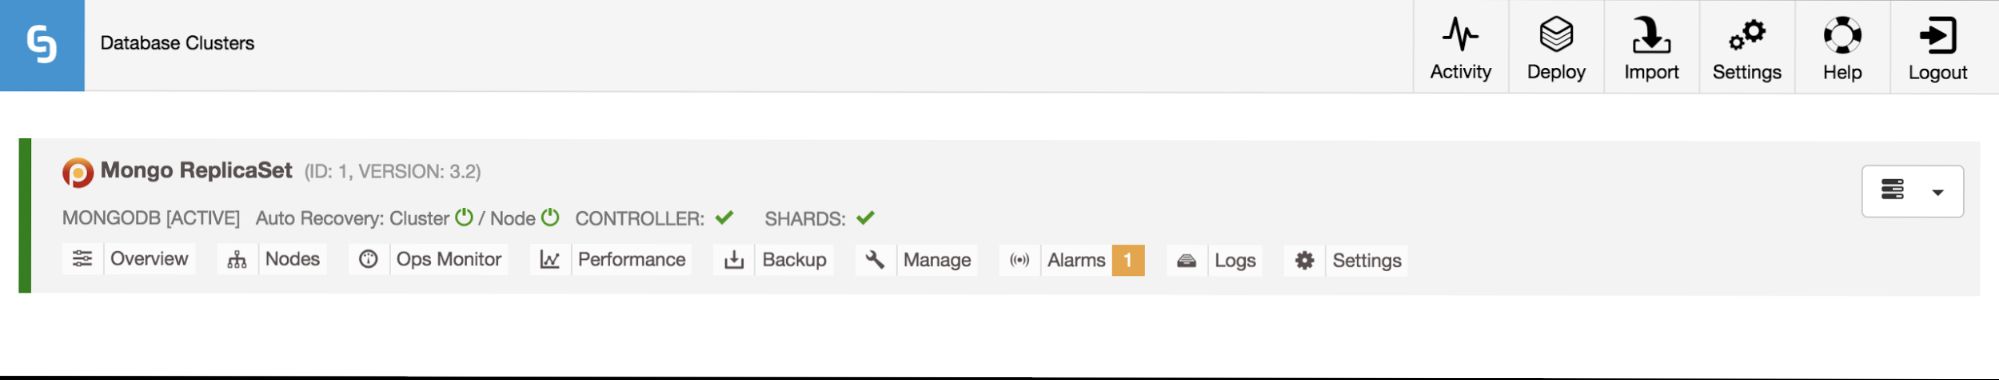
After the shard migration job has finished, the cluster overview now displays shards instead of replicaSet instances:
Image may be NSFW. Clik here to view.
After converting to a sharded cluster, new shards can be added.
Add or remove shards from a sharded MongoDB cluster
Adding shards
As a MongoDB shard is technically a replicaSet, adding a new shard involves the deployment of a new replicaSet as well. Within ClusterControl we first deploy a new replicaSet and then add it to the sharded cluster.
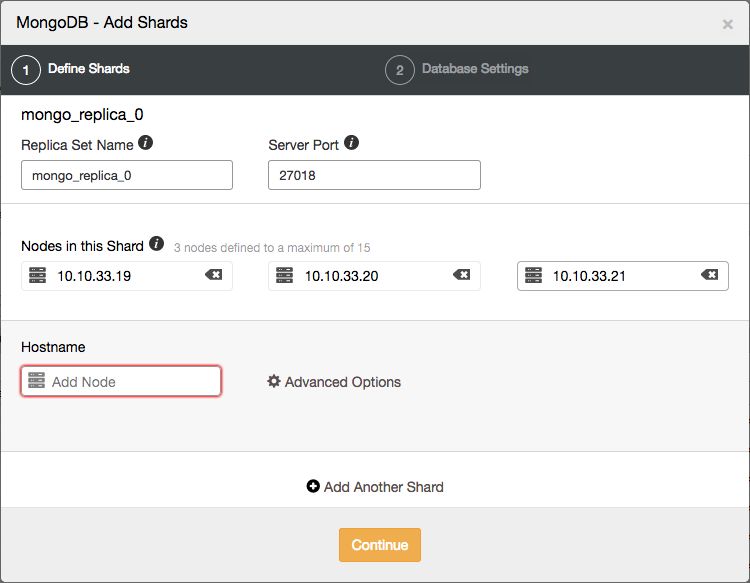
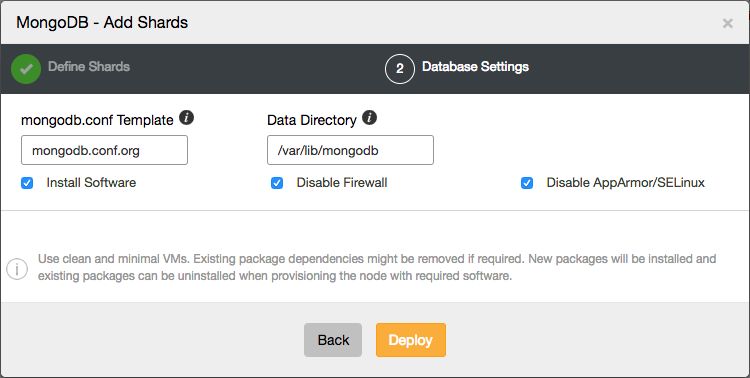
From the ClusterControl UI, you can easily add new shards with a two step wizard, opened from the actions drop down:
Image may be NSFW. Clik here to view.
Image may be NSFW. Clik here to view.
Here you can define the topology of the new shard.
Image may be NSFW. Clik here to view.
Once the new shard has been added to the cluster, the MongoDB shard router will start to assign new chunks to it, and the balancer will automatically balance all chunks over all the shards.
Removing shards
Removing shards is a bit harder than to add a shard, as this involves moving the data to the other shards before removing the shard itself. For all data that has been sharded over all shards, this will be a job performed by the MongoDB balancer.
However any non-sharded database/collection, that was assigned this shard as its primary shard, needs to be moved to another shard and made its new primary shard. For this process, MongoDB needs to know where to move these non-sharded databases/collections to.
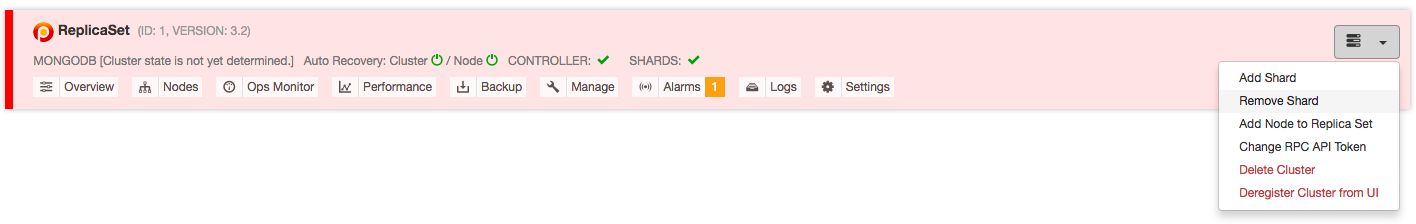
In ClusterControl you can simply remove them via the actions drop down:
Image may be NSFW. Clik here to view.
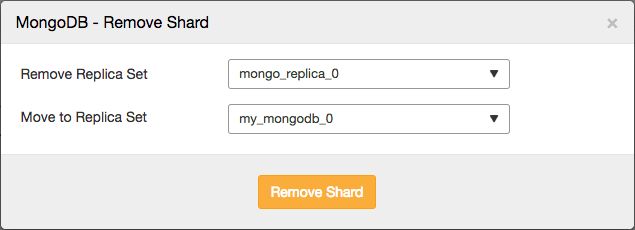
This will allow you to select the shard that you wish to remove, and the shard you wish to migrate any primary databases to:
Image may be NSFW. Clik here to view.
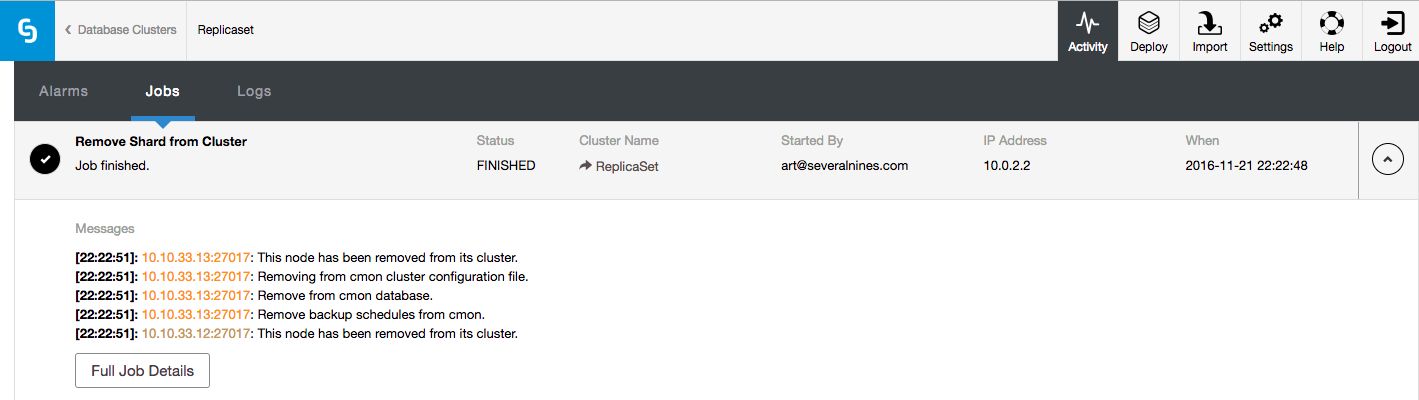
The job that removes the shard will then perform similar actions as described earlier: it will move any primary databases to the designated shard, enable the balancer and then wait for it to move all data from the shard.
Image may be NSFW. Clik here to view.
Once all the data has been removed, it will remove the shard from the UI.
Adding additional MongoDB shard routers
Once you start to scale out your application using a MongoDB sharded cluster, you may find you are in need of additional shard routers.
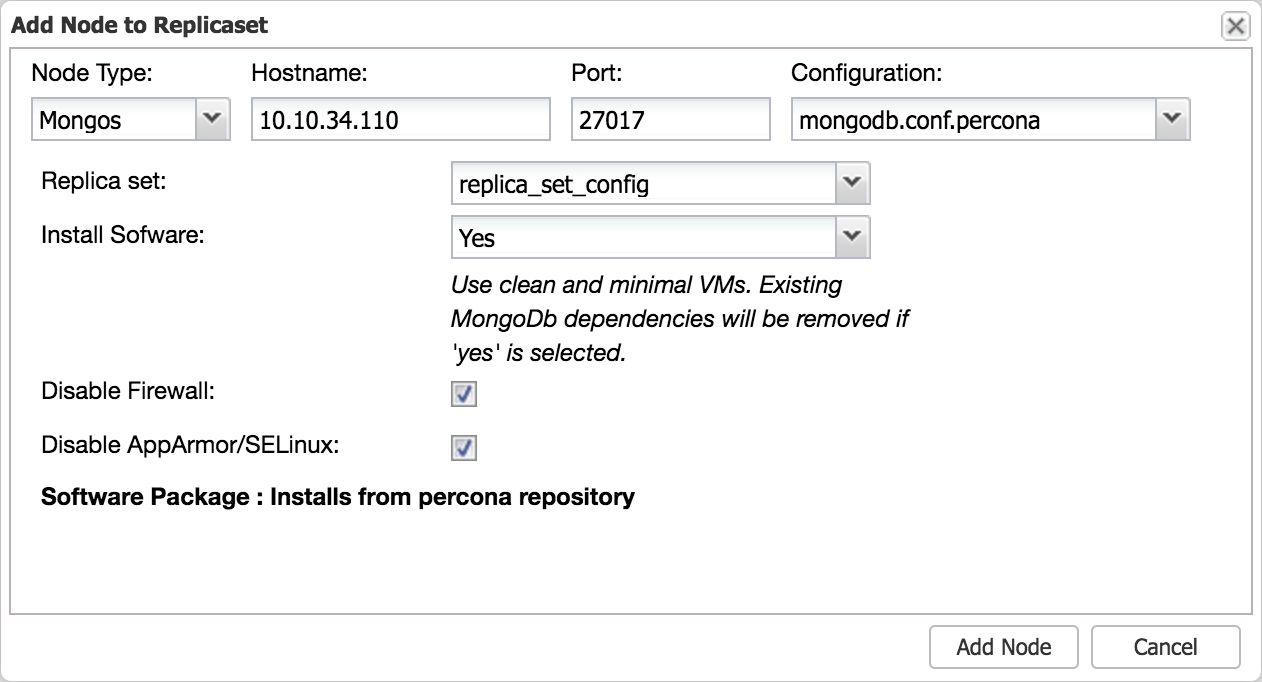
Adding additional MongoDB shard routers is a very simple process with ClusterControl, just open the Add Node dialogue from the actions drop down:
Image may be NSFW. Clik here to view.
This will add a new shard router to the cluster. Don’t forget to set the proper default port (27017) on the router.
Step down server
In case you wish to perform maintenance on the primary node in a replicaSet, it is better to have it first “step down” in a graceful manner before taking it offline. Stepping down a primary basically means the host stops being a primary and becomes a secondary and is not eligible to become a primary for a set number of seconds. The nodes in the MongoDB replicaSet with voting power, will elect a new primary with the stepped down primary excluded for the set number of seconds.
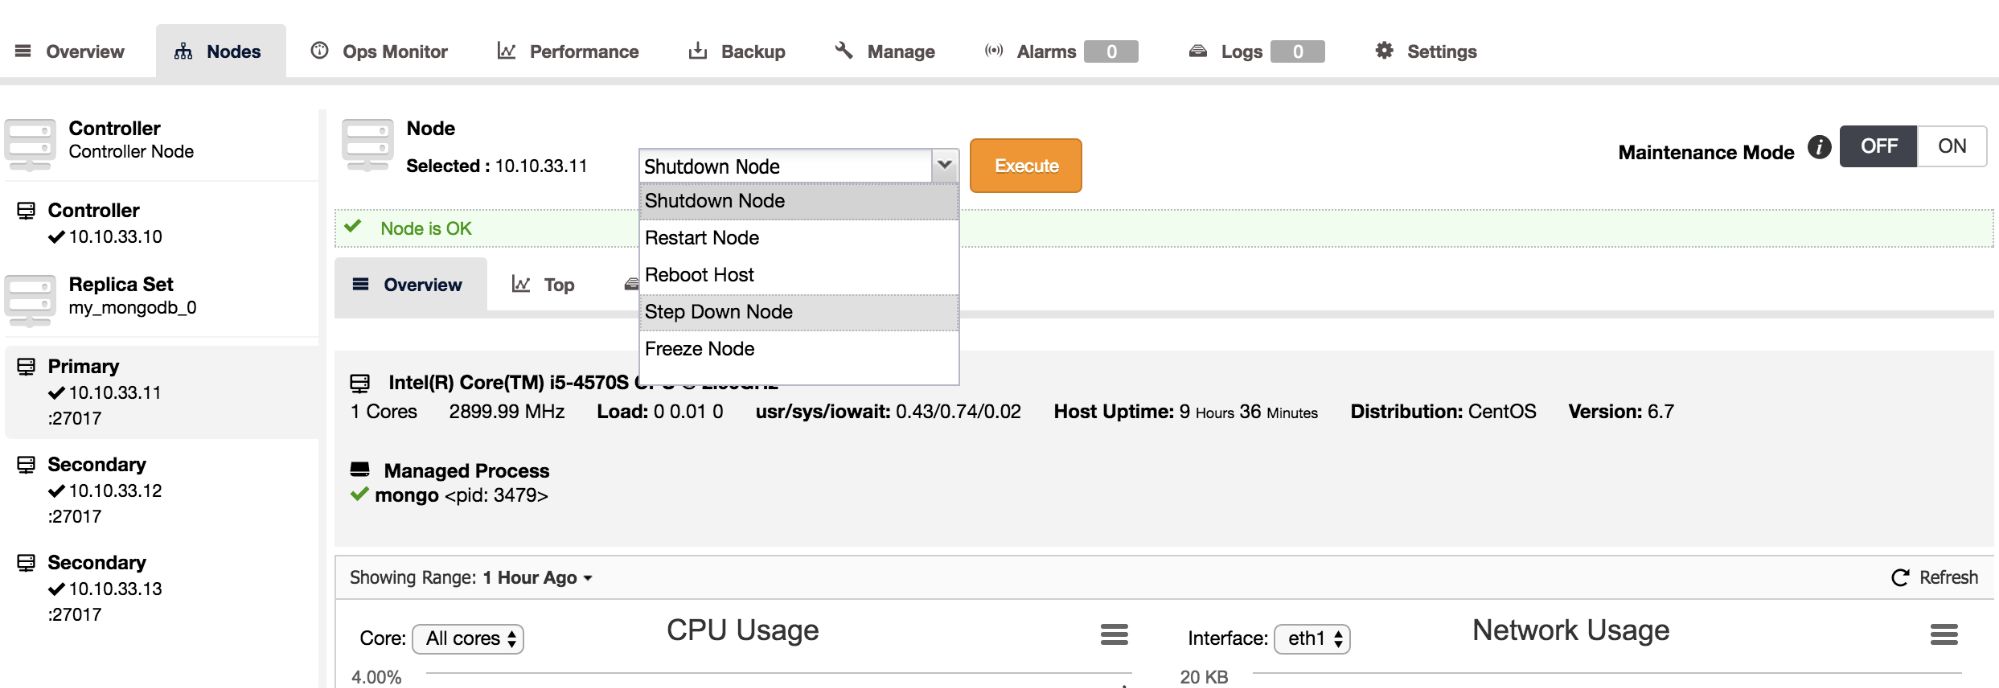
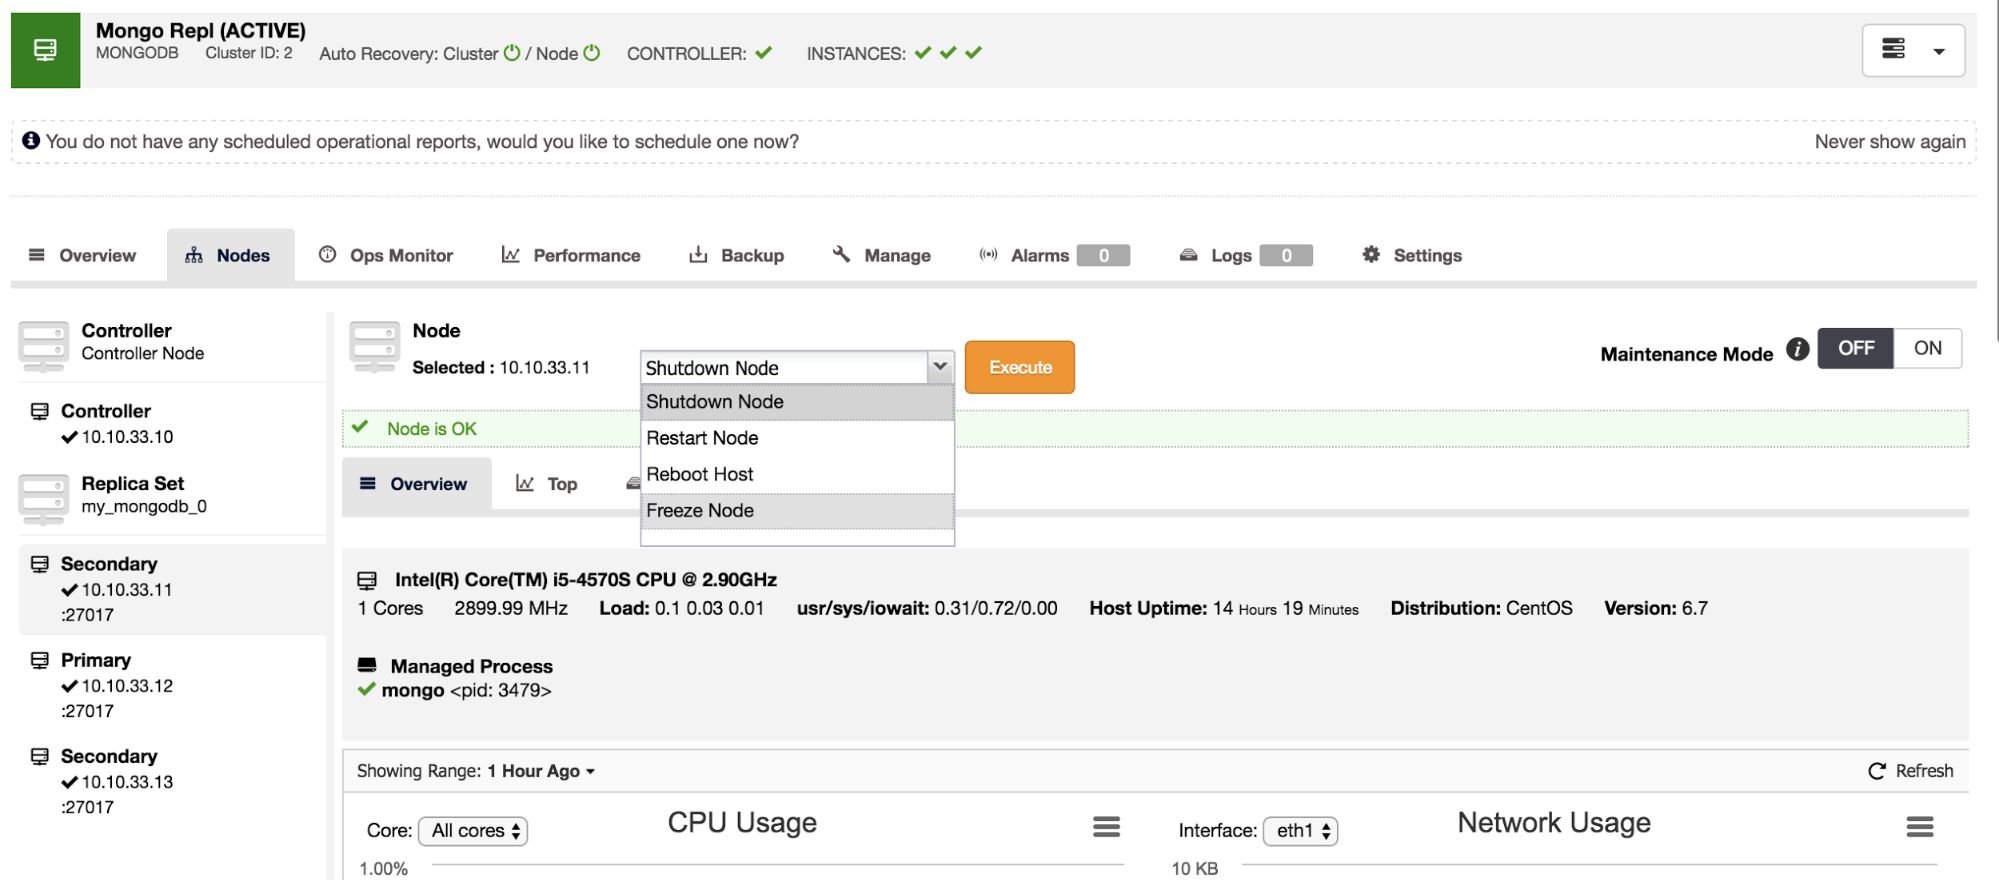
In ClusterControl we have added the step down functionality as an action on the Nodes page. To step down, simply select this as an action from the drop down:
Image may be NSFW. Clik here to view.
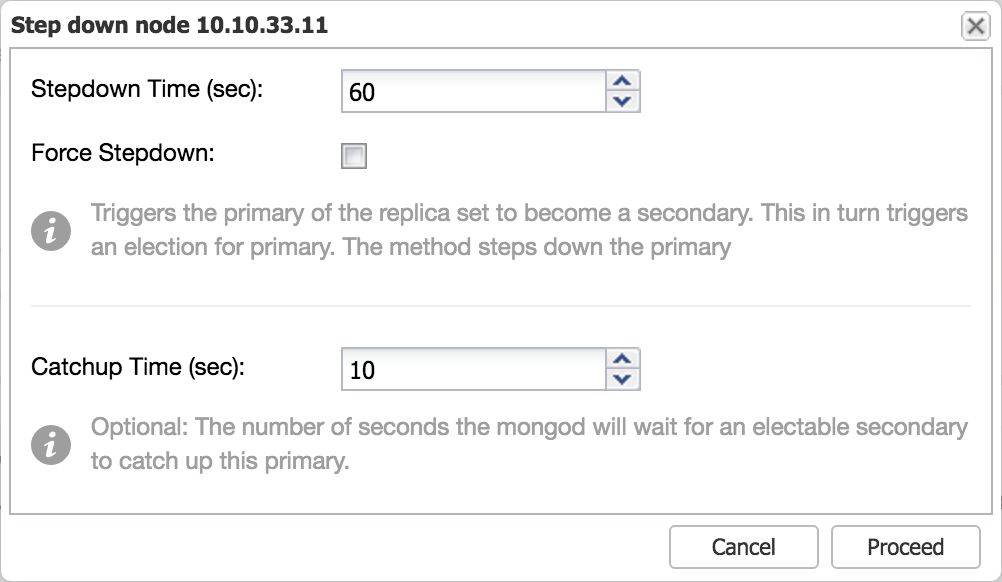
After setting the number of seconds for stepdown and confirming, the primary will step down and a new primary will be elected.
Image may be NSFW. Clik here to view.
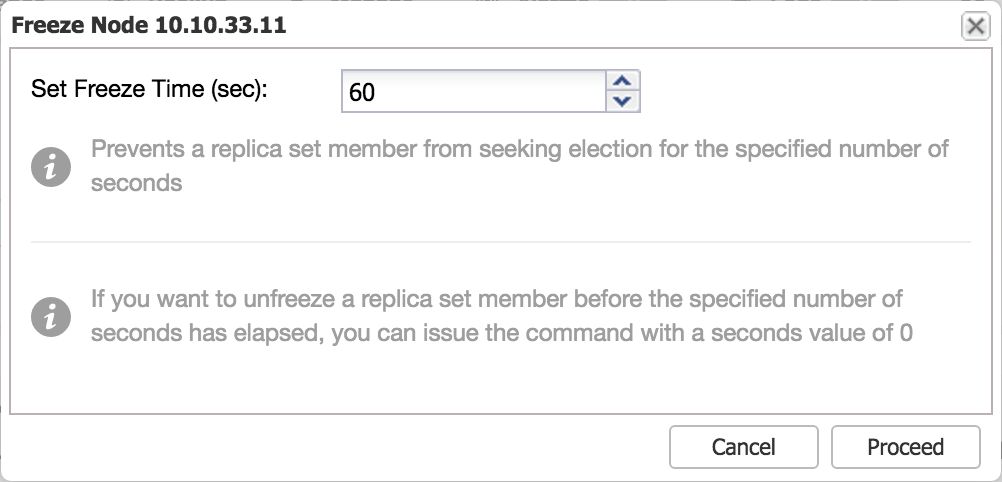
Freeze a node
This functionality is similar to the step down command: this makes a certain node ineligible to become a primary for a set number of seconds. This means you could prevent one or more secondary nodes to become a primary when stepping down the primary, and force a certain node to become the new primary this way.
In ClusterControl we have added the freeze node functionality as an action on the Nodes page. To freeze a node, simply select this as an action from the drop down:
Image may be NSFW. Clik here to view.
Image may be NSFW. Clik here to view.
After setting the number of seconds and confirming, the node will not be eligible as primary for the set number of seconds.
New MongoDB advisors
Advisors are mini programs that provide advice on specific database issues. We’ve added three new advisors for MongoDB. The first one calculates the replication window, the second watches over the replication window, and the third checks for un-sharded databases/collections.
MongoDB Replication Lag advisor
Replication lag is very important to keep an eye on, if you are scaling out reads via adding more secondaries. MongoDB will only use these secondaries if they don’t lag too far behind. If the secondary has replication lag, you risk serving out stale data that already has been overwritten on the primary.
To check the replication lag, it suffices to connect to the primary and retrieve this data using the replSetGetStatus command. In contrary to MySQL, the primary keeps track of the replication status of its secondaries.
We have implemented this check into an advisor in ClusterControl, to ensure your replication lag will always be watched over.
MongoDB Replication Window advisor
Just like the replication lag, the replication window is an equally important metric to look at. The lag advisor already informs us of the number of seconds a secondary node is behind the primary/master. As the oplog is limited in size, having slave lag imposes the following risks:
If a node lags too far behind, it may not be able to catch up anymore as the transactions necessary to catch up are no longer in the oplog of the primary.
A lagging secondary node is less favoured in a MongoDB election for a new primary. If all secondaries are lagging behind in replication, you will have a problem and one with the least lag will be made primary.
Secondaries lagging behind are less favoured by the MongoDB driver when scaling out reads with MongoDB, it also adds a higher workload on the remaining secondaries.
If we would have a secondary node lagging behind by a few minutes (or hours), it would be useful to have an advisor that informs us how much time we have left before our next transaction will be dropped from the oplog. The time difference between the first and last entry in the oplog is called the Replication Window. This metric can be created by fetching the first and last items from the oplog, and calculating the difference of their timestamps.
In the MongoDB shell, there is already a function available that calculates the replication window for you. However this function is built into the command line shell, so any outside connection not using the command line shell will not have this built-in function. Therefore we have made an advisor that will watch over the replication window and alerts you if you exceed a pre-set threshold.
MongoDB un-sharded databases and collections advisor
Non-sharded databases and collections will be assigned to a default primary shard by the MongoDB shard router. This means the database or collection is limited to the size of this primary shard, and if written to in large volumes, could use up all remaining disk space of a shard. Once this happens the shard will obviously no longer function. Therefore it is important to watch over all existing databases and collections, and scan the config database to validate that they have been enabled for sharding.
To prevent this from happening, we have created an un-sharded database and collection advisor. This advisor will scan every database and collection, and warn you if it has not been sharded.
ClusterControl improved the MongoDB maintainability
We have made a big step by adding all the improvements to ClusterControl for MongoDB replicaSets and sharded clusters. This improves the usability for MongoDB greatly, and allows DBAs, sysops and devops to maintain their clusters even better!
MySQL replication setups are inevitably related to failovers. Unlike multi-master clusters like Galera, there is one single writer in a whole setup - the master. If the master fails, one of the slaves will have to take its role through the process of failover. Such process is tricky and potentially, it may cause data loss. It may happen, for example, if a slave is not up to date while it is promoted. The master may also die before it is able to transfer all binlog events to at least one of its slaves.
Different people have different takes on how to perform failover. It depends on personal preferences but also on requirements of the business. There are two main options - automated failover or manual failover.
Automated failover comes in very handy if you want your environment to run 24x7, and to recover quickly from any failures. Unfortunately, this may come at a cost - in more complex failure scenarios, automated failover may not work correctly or, even worse, it may result in your data being messed up and partially missing (although one might argue that a human can also make disastrous mistakes leading to similar consequences). Those who prefer to keep close control over their database may choose to skip automated failover and use a manual process instead. Such process takes more time, but it allows an experienced DBA to assess the state of a system and take corrective actions based on what happened.
ClusterControl already supports automated failover for master-master clusters like Galera and NDB Cluster. Now with 1.4, it also does this for MySQL replication. In this blog post, we’ll take you through the failover process, discussing how ClusterControl does it, and what can be configured by the user.
Configuring Automatic Failover
Failover in ClusterControl can be configured to be automatic or not. If you prefer to take care of failover manually, you can disable automated cluster recovery. By default, cluster recovery is enabled and automated failover is used. Once you make changes in the UI, make sure you also make them in the cmon configuration and set enable_cluster_autorecovery to ‘0’. Otherwise your settings will be overwritten when the cmon process is restarted.
Image may be NSFW. Clik here to view.
Failover is initiated by ClusterControl when it detects that there is no host with read_only flag disabled. It can happen because master (which has read_only set to 0) is not available or it can be triggered by a user or some external software that changed this flag on the master. If you do manual changes to the database nodes or have software that may fiddle with the read_only settings, then you should disable automatic failover.
Also, note that failover is attempted only once. Should a failover attempt fail, then no more attempts will be made until the controller is restarted.
At the beginning of the failover procedure, ClusterControl builds a list of slaves which can be promoted to master. Most of the time, it will contain all slaves in the topology but the user has some additional control over it. There are two variables you can set in the cmon configuration:
replicaton_failover_whitelist
and
replicaton_failover_blacklist
First of them, when used, contains a list of IP’s or hostnames of slaves which should be used as potential master candidates. If this variable is set, only those hosts will be considered.
Second variable may contain list of hosts which will never be considered a master candidate. You can use it to list slaves that are used for backups or analytical queries. If the hardware varies between slaves, you may want to put here the slaves which use slower hardware.
Replication_failover_whitelist takes precedence, meaning the replication_failover_blacklist is ignored if replication_failover_whitelist is set.
Once the list of slaves which may be promoted to master is ready, ClusterControl starts to compare their state, looking for the most up to date slave. Here, the handling of MariaDB and MySQL-based setups differs. For MariaDB setups, ClusterControl picks a slave which has the lowest replication lag of all slaves available. For MySQL setups, ClusterControl picks such a slave as well but then it checks for additional, missing transactions which could have been executed on some of the remaining slaves. If such a transaction is found, ClusterControl slaves the master candidate off that host in order to retrieve all missing transactions.
In case you’d like to skip this process and just use the most advanced slave, you can set the following setting in the cmon configuration:
replication_skip_apply_missing_txs=1
Such process may result in a serious problem though - if an errant transaction is found, replication may be broken. What is an errant transaction? In short, it is a transaction that has been executed on a slave but it’s not coming from the master. It could have been, for example, executed locally. The problem is caused by the fact that, while using GTID, if a host, which has such errant transaction, becomes a master, all slaves will ask for this missing transaction in order to be in sync with their new master. If the errant transaction happened way in the past, it may not longer be available in binary logs. In that case, replication will break because slaves won’t be able to retrieve the missing data. If you would like to learn more about errant transactions, we have a blog post covering this topic.
Of course, we don’t want to see replication breaking, therefore ClusterControl, by default, checks for any errant transactions before it promotes a master candidate to become a master. If such problem is detected, the master switch is aborted and ClusterControl lets the user fix the problem manually. The blog post we mentioned above explains how you can manually fix issues with errant transactions.
If you want to be 100% certain that ClusterControl will promote a new master even if some issues are detected, you can do that using the replication_stop_on_error=0 setting in cmon configuration. Of course, as we discussed, it may lead to problems with replication - slaves may start asking for a binary log event which is not available anymore. To handle such cases we added experimental support for slave rebuilding. If you set replication_auto_rebuild_slave=1 in the cmon configuration and if your slave is marked as down with the following error in MySQL:
Got fatal error 1236 from master when reading data from binary log: 'The slave is connecting using CHANGE MASTER TO MASTER_AUTO_POSITION = 1, but the master has purged binary logs containing GTIDs that the slave requires.'
ClusterControl will attempt to rebuild the slave using data from the master. Such a setting may not always be appropriate as the rebuilding process will induce an increased load on the master. It may also be that your dataset is very large and a regular rebuild is not an option - that’s why this behavior is disabled by default.
Once we ensure that no errant transactions exist and we are good to go, there is still one more issue we need to handle somehow - it may happen that all slaves are lagging behind the master.
As you probably know, replication in MySQL works in a rather simple way. The master stores writes in binary logs. The slave’s I/O thread connects to the master and pulls any binary log events it is missing. It then stores them in the form of relay logs. The SQL thread parses them and applies events. Slave lag is a condition in which SQL thread (or threads) cannot cope with the number of events, and is unable to apply them as soon as they are pulled from the master by the I/O thread. Such situation may happen no matter what type of replication you are using. Even if you use semi-sync replication, it can only guarantee that all events from the master are stored on one of slaves in the relay log. It doesn’t say anything about applying those events to a slave.
The problem here is that, if a slave is promoted to master, relay logs will be wiped out. If a slave is lagging and hasn’t applied all transactions, it will lose data - events that are not yet applied from relay logs will be lost forever.
There is no one-size-fits-all way of solving this situation. ClusterControl gives users control over how it should be done, maintaining safe defaults. It is done in cmon configuration using the following setting:
Replication_failover_wait_to_apply_timeout
By default it takes a value of ‘-1’, which means that failover won’t happen if a master candidate is lagging. ClusterControl will wait indefinitely for it to apply all missing transactions from its relay logs. This is safe, but, if for some reason, the most up-to-date slave is lagging badly, failover may takes hours to complete. On the other side of the spectrum is setting it to ‘0’ - it means that failover happens immediately, no matter if the master candidate is lagging or not. You can also go the middle way and set it to some value. This will set a time in seconds, during which ClusterControl will wait for a master candidate to apply missing transactions from its relay logs. Failover happens after the defined time or when the master candidate will catch up on replication - whichever happens first. This may be a good choice if your application has specific requirements regarding downtime and you have to elect a new master within a short time window.
When using MySQL replication along with proxies like ProxySQL, ClusterControl can help you build an environment in which the failover process is barely noticeable by the application. Below we’ll show how the failover process may look like in a typical replication setup - one master with two slaves. We will use ProxySQL to detect topology changes and route traffic to the correct hosts.
First, we’ll start our “application” - sysbench:
root@ip-172-30-4-48:~# while true ; do sysbench --test=/root/sysbench/sysbench/tests/db/oltp.lua --num-threads=2 --max-requests=0 --max-time=0 --mysql-host=172.30.4.48 --mysql-user=sbtest --mysql-password=sbtest --mysql-port=6033 --oltp-tables-count=32 --report-interval=1 --oltp-skip-trx=on --oltp-table-size=100000 run ; done
It will connect to ProxySQL (port 6033) and use it to distribute traffic between master and slaves. We simulate default behavior of autocommit=1 in MySQL by disabling transactions for Sysbench.
At first, it verifies state of replication on all nodes in the cluster. Among other things, ClusterControl looks for the most up to date slave in the topology and picks it as master candidate.
ID:79575 [13:18:34]: Checking 172.30.4.99:3306
ID:79576 [13:18:34]: ioerrno=2003 io running 0 on 172.30.4.99:3306
ID:79577 [13:18:34]: Checking 172.30.4.4:3306
ID:79578 [13:18:34]: ioerrno=2003 io running 0 on 172.30.4.4:3306
ID:79579 [13:18:34]: Checking 172.30.4.112:3306
ID:79580 [13:18:34]: 172.30.4.112:3306: is not connected. Checking if this is the failed master.
ID:79581 [13:18:34]: 172.30.4.99:3306: Checking if slave can be used as a candidate.
ID:79582 [13:18:34]: Adding 172.30.4.99:3306 to slave list
ID:79583 [13:18:34]: 172.30.4.4:3306: Checking if slave can be used as a candidate.
ID:79584 [13:18:34]: Adding 172.30.4.4:3306 to slave list
ID:79585 [13:18:34]: 172.30.4.4:3306: Slave lag is 4 seconds.
ID:79586 [13:18:34]: 172.30.4.99:3306: Slave lag is 20 seconds >= 4 seconds, not a possible candidate.
ID:79587 [13:18:34]: 172.30.4.4:3306 elected as the new Master.
Then, it’s time to ensure no errant transactions are found, which could prevent the whole failover process from happening.
ID:79594 [13:18:34]: Checking for errant transactions.
ID:79595 [13:18:34]: 172.30.4.99:3306: Skipping, same as slave 172.30.4.99:3306
ID:79596 [13:18:34]: 172.30.4.99:3306: Comparing to 172.30.4.4:3306, master_uuid = 'e4864640-baff-11e6-8eae-1212bbde1380'
ID:79597 [13:18:34]: 172.30.4.4:3306: Checking for errant transactions.
ID:79598 [13:18:34]: 172.30.4.112:3306: Skipping, same as master 172.30.4.112:3306
ID:79599 [13:18:35]: 172.30.4.4:3306: Comparing to 172.30.4.99:3306, master_uuid = 'e4864640-baff-11e6-8eae-1212bbde1380'
ID:79600 [13:18:35]: 172.30.4.99:3306: Checking for errant transactions.
ID:79601 [13:18:35]: 172.30.4.4:3306: Skipping, same as slave 172.30.4.4:3306
ID:79602 [13:18:35]: 172.30.4.112:3306: Skipping, same as master 172.30.4.112:3306
ID:79603 [13:18:35]: No errant transactions found.
During the last preparation step, missing transactions are being applied on the master candidate - we want it to fully catch up on the replication before we proceed with failover. In our case, to ensure that failover will happen even if slave is badly lagging, we enforced 600 second limit - slave will try to replay any missing transactions from its relay logs but if it will take more than 600 seconds, we will force a failover.
ID:79604 [13:18:35]: 172.30.4.4:3306: preparing candidate.
ID:79605 [13:18:35]: 172.30.4.4:3306: Checking if there the candidate has relay log to apply.
ID:79606 [13:18:35]: 172.30.4.4:3306: waiting up to 600 seconds before timing out.
ID:79608 [13:18:37]: 172.30.4.4:3306: Applied 391 transactions
ID:79609 [13:18:37]: 172.30.4.4:3306: Executing 'SELECT WAIT_UNTIL_SQL_THREAD_AFTER_GTIDS('e4864640-baff-11e6-8eae-1212bbde1380:16340-23420', 5)' (waited 5 out of maximally 600 seconds).
ID:79610 [13:18:37]: 172.30.4.4:3306: Applied 0 transactions
ID:79611 [13:18:37]: 172.30.4.99:3306: No missing transactions found.
ID:79612 [13:18:37]: 172.30.4.4:3306: Up to date with temporary master 172.30.4.99:3306
ID:79613 [13:18:37]: 172.30.4.4:3306: Completed preparations of candidate.
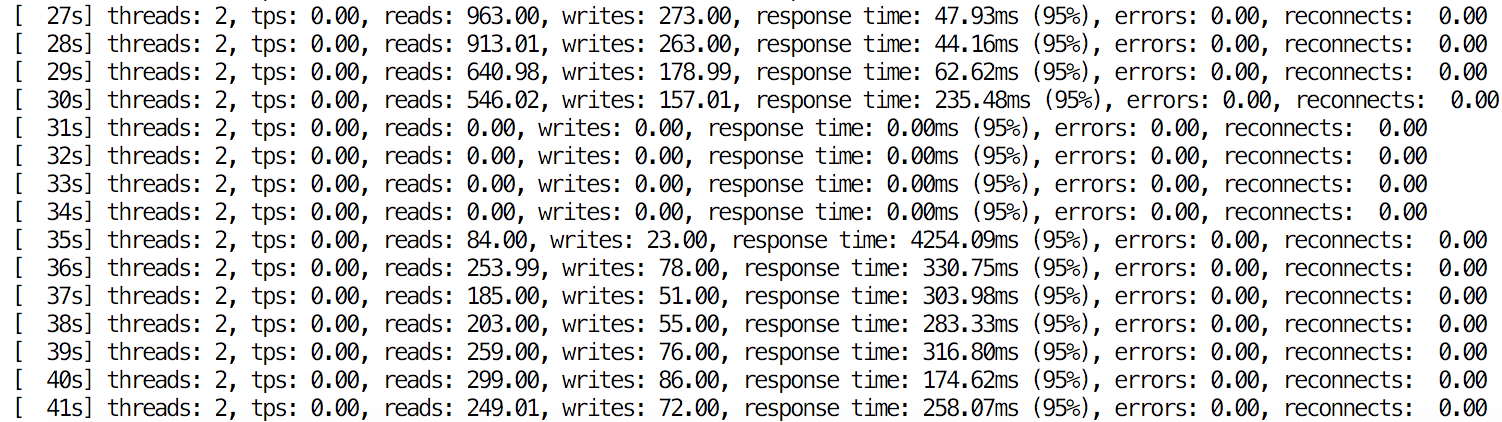
Finally, failover happens. From the application’s standpoint, the impact was minimal - the process took less than 5 seconds, during which the application had to wait for queries to execute. Of course, it depends on multiple factors - the main one is replication lag as the failover process, by default, requires the slave to be up-to-date. Catching up can take quite some time if the slave is lagging behind heavily.
Image may be NSFW. Clik here to view.
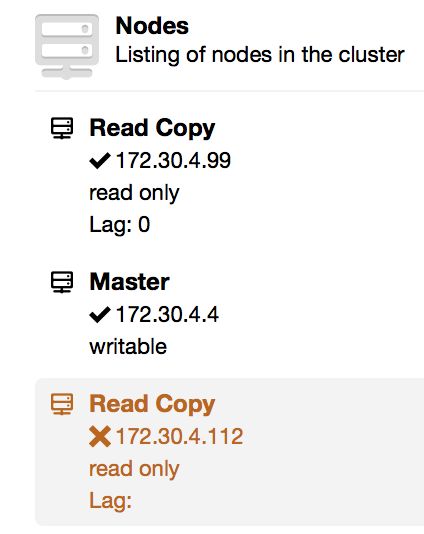
At the end, we have a new replication topology. A new master has been elected and the second slave has been reslaved. The old master, on the other hand, is stopped. This is intentional as we want the user to be able to investigate the state of the old master before performing any further changes (e.g., slaving it off a new master or rebuilding it).
Image may be NSFW. Clik here to view.
We hope this mechanism will be useful in maintaining high availability of replication setups. If you have any feedback on it, let us know as we’d love to hear from you.
ClusterControl
Single Console for Your Entire Database Infrastructure
Join us next Tuesday, February 7th 2017, as Johan Andersson, CTO at Severalnines, unveils the new ClusterControl 1.4 in a live demo webinar.
ClusterControl reduces complexity of managing your database infrastructure while adding support for new technologies; enabling you to truly automate multiple environments for next-level applications. This latest release further builds out the functionality of ClusterControl to allow you to manage and secure your 24/7, mission critical infrastructures.
In this live webinar, Johan will demonstrate how ClusterControl increases your efficiency by giving you a single interface to deploy and operate your databases, instead of searching for and cobbling together a combination of open source tools, utilities and scripts that need constant updates and maintenance. Watch as ClusterControl demystifies the complexity associated with database high availability, load balancing, recovery and your other everyday struggles.
To put it simply: learn how to be a database hero with ClusterControl!
Date, Time & Registation
Europe/MEA/APAC
Tuesday, February 7th at 09:00 GMT (UK) / 10:00 CET (Germany, France, Sweden)
‘Always on Databases’ with enhanced MySQL Replication functions
‘Safer NoSQL’ with MongoDB and larger sharded cluster deployments
‘Enabling the DBA’ with ProxySQL, HAProxy and MaxScale
Backing up your open source databases
Live Demo
Q&A
Speaker
Image may be NSFW. Clik here to view.
Johan Andersson, CTO, Severalnines
Johan's technical background and interest are in high performance computing as demonstrated by the work he did on main-memory clustered databases at Ericsson as well as his research on parallel Java Virtual Machines at Trinity College Dublin in Ireland. Prior to co-founding Severalnines, Johan was Principal Consultant and lead of the MySQL Clustering & High Availability consulting group at MySQL / Sun Microsystems / Oracle, where he designed and implemented large-scale MySQL systems for key customers. Johan is a regular speaker at MySQL User Conferences as well as other high profile community gatherings with popular talks and tutorials around architecting and tuning MySQL Clusters.
We look forward to “seeing” you there and to insightful discussions!
If you have any questions or would like a personalised live demo, please do contact us.
The video below demonstrates the top features and functions included in ClusterControl.
ClusterControl is an all-inclusive database management system that lets you easily deploy, monitor, manage and scale highly available open source databases on-premise or in the cloud.
Included in this presentation are…
Deploying MySQL, MongoDB & PostgreSQL nodes and clusters
Overview of the monitoring dashboard
Individual node or cluster monitoring
Query monitor system
Creating and restoring immediate and scheduled backups
ClusterControl makes it easy to deploy a database setup - just fill in some values (database vendor, database data directory, password and hostnames) in the deployment wizard and you’re good to go. The rest of the configuration options will be automatically determined (and calculated) based on the host specifications (CPU cores, memory, IP address etc) and applied to the template file that comes with ClusterControl. In this blog post, we are going to look into how ClusterControl uses default template files and how users can customize them to their needs.
Base Template Files
All services configured by ClusterControl use a base configuration template available under /usr/share/cmon/templates on the ClusterControl node. The following are template files provided by ClusterControl v1.4.0:
Filename
Description
config.ini.mc
MySQL Cluster configuration file.
haproxy.cfg
HAProxy configuration template for Galera Cluster.
haproxy_rw_split.cfg
HAProxy configuration template for read-write splitting.
Legacy keepalived configuration file (pre 1.2.7). This is deprecated.
keepalived.conf
Keepalived configuration file.
keepalived.init
Keepalived init script.
MaxScale_template.cnf
MaxScale configuration template.
mongodb-2.6.conf.org
MongoDB 2.x configuration template.
mongodb.conf.org
MongoDB 3.x configuration template.
mongodb.conf.percona
MongoDB 3.x configuration template for Percona Server for MongoDB.
mongos.conf.org
Mongo router (mongos) configuration template.
my.cnf.galera
MySQL configuration template for Galera Cluster.
my57.cnf.galera
MySQL configuration template for Galera Cluster on MySQL 5.7.
my.cnf.grouprepl
MySQL configuration template for MySQL Group Replication.
my.cnf.gtid_replication
MySQL configuration template for MySQL Replication with GTID.
my.cnf.mysqlcluster
MySQL configuration template for MySQL Cluster.
my.cnf.pxc55
MySQL configuration template for Percona XtraDB Cluster v5.5.
my.cnf.repl57
MySQL configuration template for MySQL Replication v5.7.
my.cnf.replication
MySQL configuration template for MySQL/MariaDB without MySQL’s GTID.
mysqlchk.galera
MySQL health check script template for Galera Cluster.
mysqlchk.mysql
MySQL health check script template for MySQL Replication.
mysqlchk_xinetd
Xinetd configuration template for MySQL health check.
mysqld.service.override
Systemd unit file template for MySQL service.
proxysql_template.cnf
ProxySQL configuration template.
The above list depends upon the feature set provided by the installed ClusterControl release. In an older version, you might not find some of them. You can modify these template files directly, although we do not recommend it as explained in the next sections.
Configuration Manager
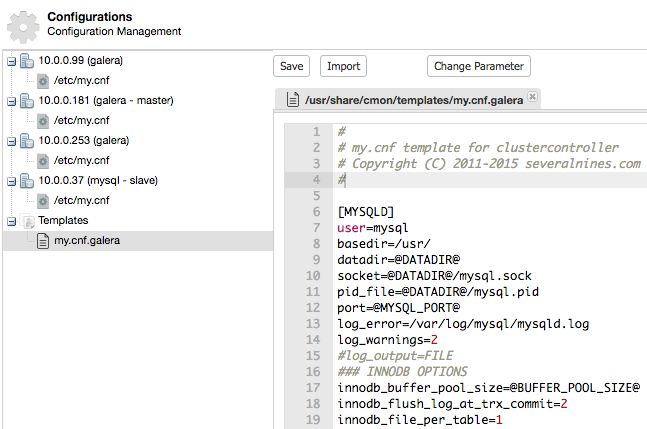
Depending on the cluster type, ClusterControl will then import the necessary base template file into CMON database and accessible via Manage -> Configurations -> Templates once deployment succeeds. For example, consider the following configuration template for a MariaDB Galera Cluster:
Image may be NSFW. Clik here to view.
ClusterControl will load the base template content of Galera configuration template from /usr/share/cmon/templates/my.cnf.galera into CMON database (inside cluster_configuration_templates table) after deployment succeeds. You can then customize your own configuration file directly in the ClusterControl UI. Whenever you hit the Save button, the new version of configuration template will be stored inside CMON database, without overwriting the base template file.
Once the cluster is deployed and running, the template in the UI takes precedence. The base template file is only used during the initial cluster deployment via ClusterControl -> Deploy -> Deploy Database Cluster. During the deployment stage, ClusterControl will use a temporary directory located at /var/tmp/ to prepare the content, for example:
/var/tmp/cmon-003862-6a7775ca76c62486.tmp
Dynamic Variables
There are a number configuration variables which configurable dynamically by ClusterControl. These variables are represented with capital letters enclosed by at sign ‘@’, for example @DATADIR@. For full details on supported variables, please refer to this page. Dynamic variables are automatically configured based on the input specified during cluster deployment, or ClusterControl performs automatic detection based on hostname, IP address, available RAM, number of CPU cores and so on. This simplifies the deployment where you only need to specify minimal options during cluster deployment stage
If the dynamic variable is replaced with a value (or undefined), ClusterControl will skip it and use the configured value instead. This is handy for advanced users, where usually have their own set of configuration options that tailored for specific database workloads.
Pre-deployment Configuration Template Example
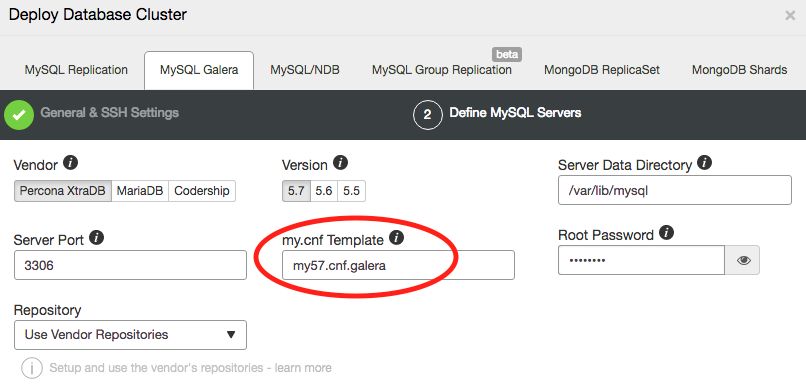
Instead of relying on ClusterControl’s dynamic variable on the number of max_connections for our database nodes, we can change the following line inside /usr/share/cmon/templates/my57.cnf.galera, from:
max_connections=@MAX_CONNECTIONS@
To:
max_connections=50
Save the text file and on the Deploy Database Cluster dialog, ensure ClusterControl uses the correct base template file:
Image may be NSFW. Clik here to view.
Click on Deploy button to start the database cluster deployment.
Post-deployment Configuration Template Example
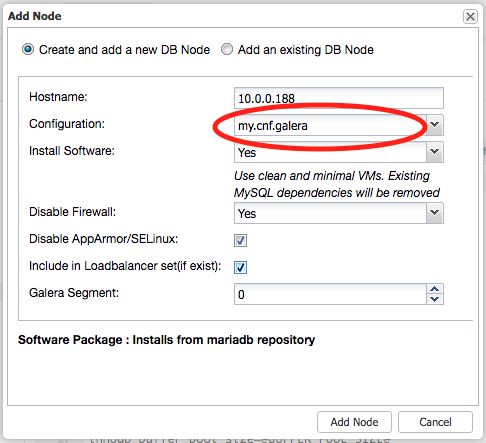
After the database cluster deployment completes, you might have done some fine tuning on the running servers before deciding to scale it up. When scaling up, ClusterControl will use the configuration template inside CMON database (the one populated under ClusterControl -> Configurations -> Templates) to deploy the new nodes. Hence do remember to apply the modification you made on the database server to the template file.
Before adding a new node, it’s a good practice to review the configuration template to ensure that the new node gets what we expected. Then, go to ClusterControl -> Add Node and ensure the correct MySQL template file is selected:
Image may be NSFW. Clik here to view.
Then, click on “Add Node” button to start the deployment.
That’s it. Even though ClusterControl does various automation jobs when it comes to deployment, it still provides freedom for users to customize the deployment accordingly. Happy clustering!
ClusterControl 1.4 introduces some major improvements in the area of backup management, with a revamped interface and simplified options to create backups. In this blog post, we’ll have a look at the new backup features available in this release.
If you upgrade ClusterControl from version 1.3.x to version 1.4, the CMON process will internally migrate all backup related data/schedules to the new interface. The migration will happen during the first startup after you have upgraded (you are required to restart the CMON process after a package upgrade). To upgrade, please refer to the documentation.
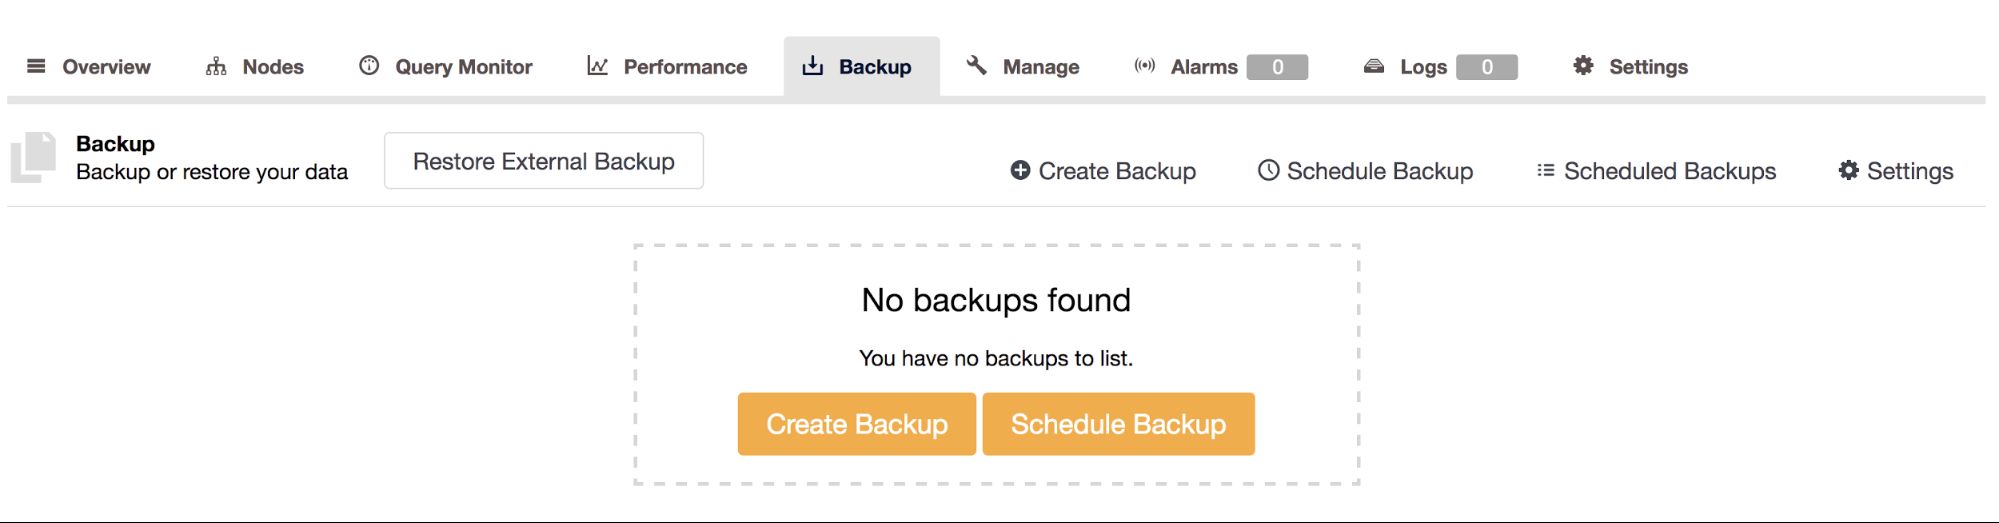
Redesigned User Interface
In the user interface, we have now consolidated related functionality onto a single interface. This includes Backup Settings, which were previously found under ClusterControl -> Settings -> Backups. It is now accessible under the same backup management tab:
Image may be NSFW. Clik here to view.
The interface is now responsive to any action taken and requires no manual refresh. When a backup is created, you will see it in the backup list with a spinning arrows icon:
Image may be NSFW. Clik here to view.
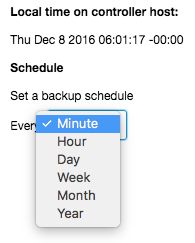
It is also possible now to schedule a backup every minute (the lowest interval) or year (the highest interval):
Image may be NSFW. Clik here to view.
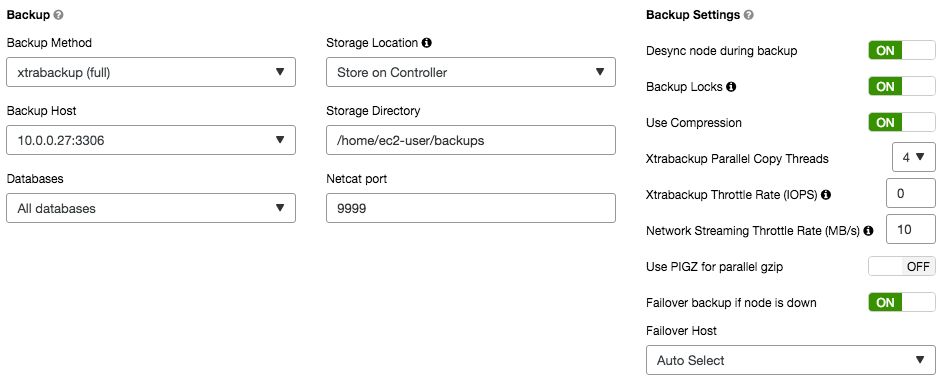
The backup options when scheduling or creating a backup now appear on the right side:
Image may be NSFW. Clik here to view.
This allows you to quickly configure the backup, rather than having to scroll down the page.
Backup Report
Here is how it used to look pre v1.4:
Image may be NSFW. Clik here to view.
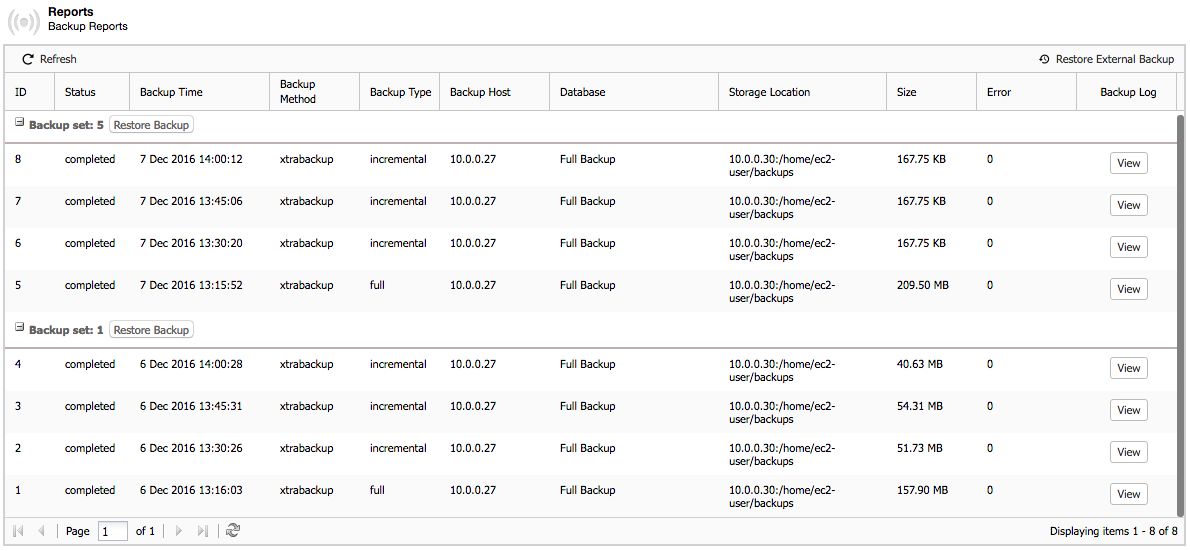
After upgrading to ClusterControl v1.4, the report will look like this:
Image may be NSFW. Clik here to view.
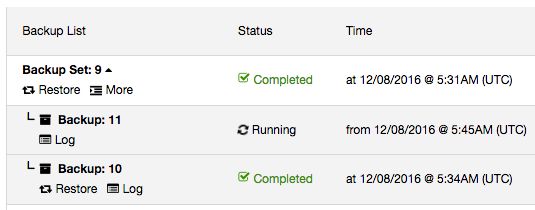
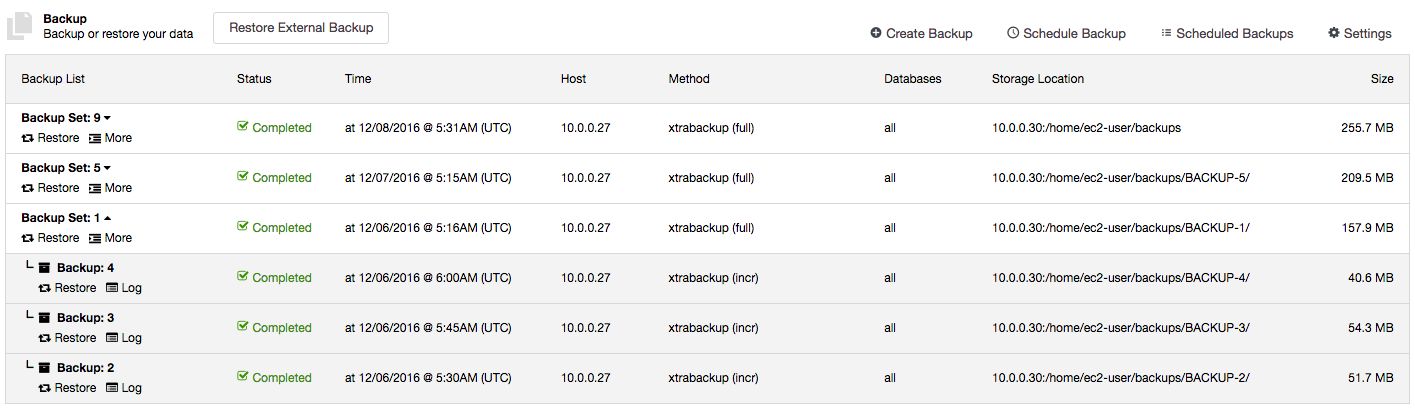
All incremental backups are automatically grouped together under the last full backup and expandable with a drop down. This makes the backups more organized per backup set. Each created backup will have “Restore” and “Log” buttons. The “Time” column also now contains timezone information, useful if you are dealing with geographically distributed infrastructure.
Restore to an Incremental Backup Point
You are now able to restore up to a certain incremental backup. Previously, ClusterControl supported restoration per backup set. All incremental backups under a single backup set would be restored and there was no way, for instance, to skip some of the incremental backups.
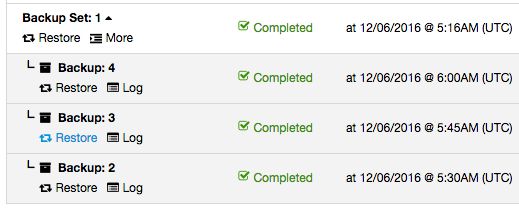
Consider the below example:
Image may be NSFW. Clik here to view.
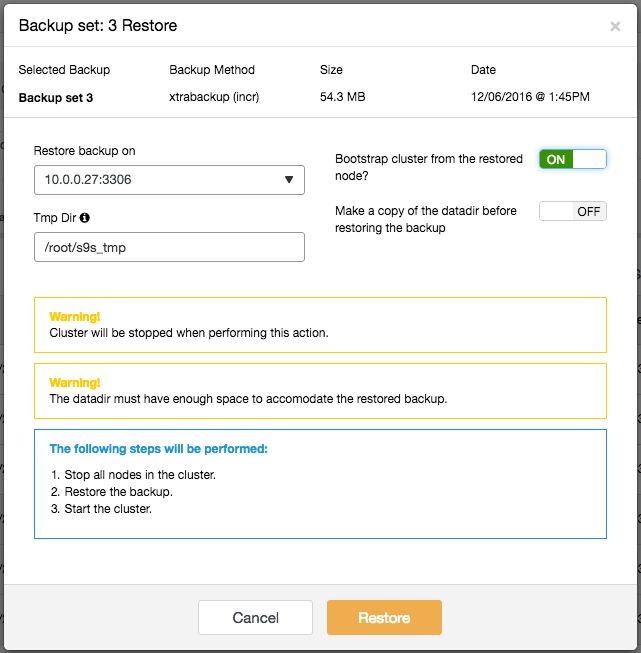
Full backup happens every day around 5:15 AM while incremental backup was scheduled every 15 minutes after the hour. If something happened around 5:50 AM and you would like to restore up to the backup taken just before that, you can skip the 6 AM backup by just clicking on the “Restore” link of the 5:45 AM incremental backup. You should then see the following Restore wizard and a couple of post-restoration options:
Image may be NSFW. Clik here to view.
ClusterControl will then prepare the backup up until the selected point and the rest will be skipped. It also highlights “Warning” and “Notes” so you are aware of what will happen with the cluster during the restoration process. Note that mysqldump restoration can be performed online, while Xtrabackup requires the cluster/database instance to be stopped.
Operational Report
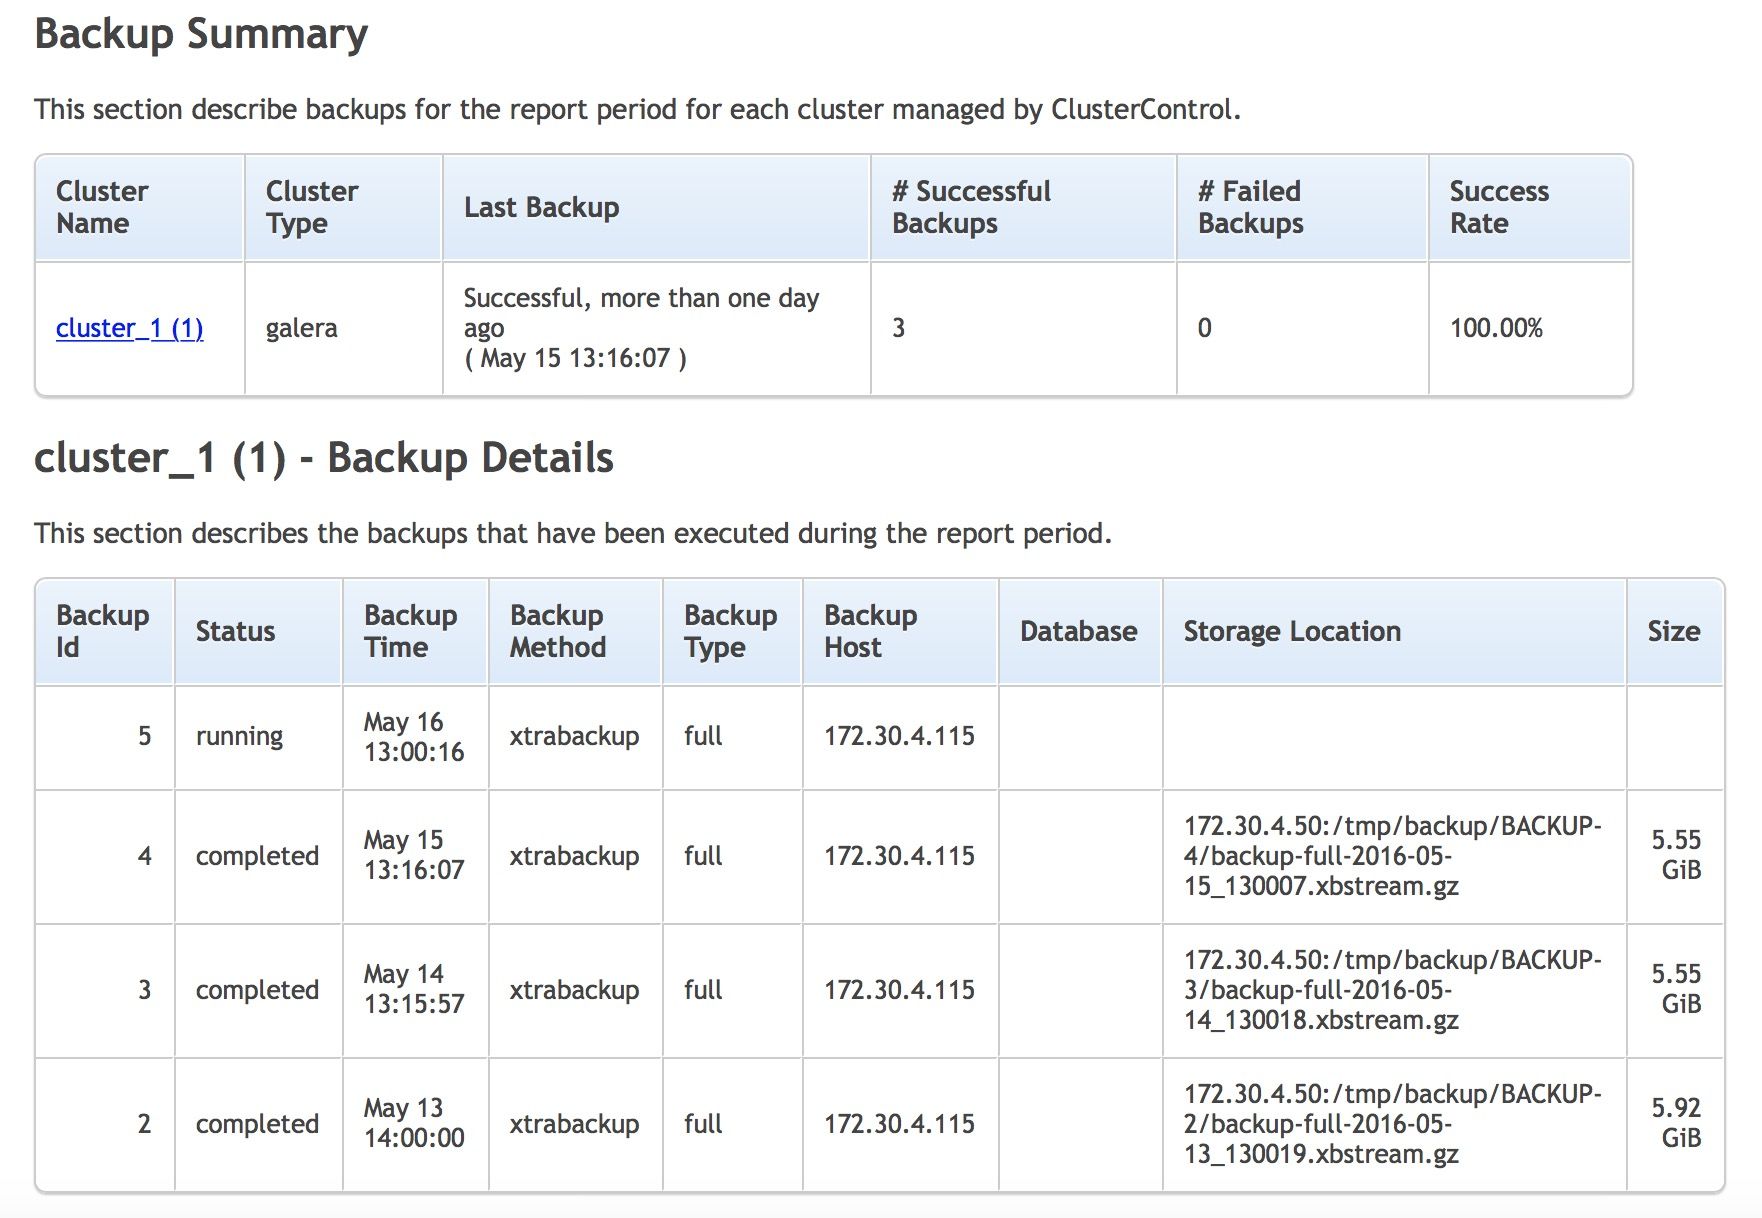
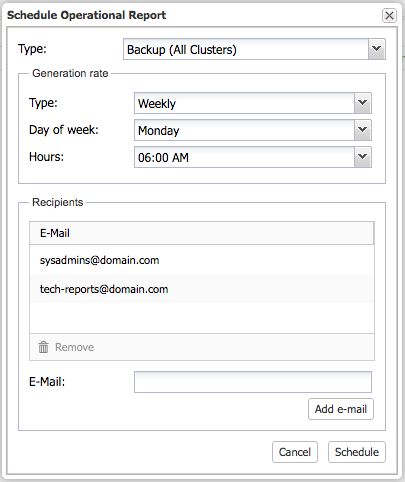
You might have multiple database systems running, and perhaps in different datacenters. Would it not be nice to get a consolidated report of the systems, when they were last backed up, and if there were any failed backups? This is available in 1.4. Note that you have other types of ops reports available in ClusterControl.
Image may be NSFW. Clik here to view.
The report contains two sections and gives you a short summary of when the last backup was created, if it completed successfully or failed. You can also check the list of backups executed on the cluster with their state, type and size. This is as close you can get to check that backups work correctly without running a full recovery test. However, we definitely recommend that such tests are regularly performed.
The operational report can be scheduled and emailed to a set of recipients under Settings -> Operational Reports section, as shown in the following screenshot:
Image may be NSFW. Clik here to view.
Access via ClusterControl RPC interface
The new backup features are now exposed under ClusterControl RPC interface, which means you can interact via API call with a correct RPC key. For example, to list the created backup on cluster ID 2, the following call should be enough:
By having those operations extensible via ClusterControl RPC, one could automate the backup management and list the backup schedule via scripting or application call. However, to create a backup, ClusterControl handles it differently via job call (operation: createJob) since some backups may take hours or days to complete. To create a backup on cluster ID 9, one would do:
The URL format is: http://[ClusterControl_host]/clusterid/job
Backup method: Xtrabackup (full)
RPC token: c8gY3Eq5iFE3DC4i (retrievable from cmon_X.cnf)
Backup host: 192.168.33.121, port 3306
Backup destination: /tmp/backups on the backup host
For example, it’s a good idea to create a backup when testing DDL queries like TRUNCATE or DROP because those are not transactions, meaning they are impossible to rollback. We are going to cover this in details in an upcoming blog post.
With a BASH script together with correct API call, it is now possible to have an automated script like the following:
There are many other reasons to upgrade to the latest ClusterControl version, the backup functionality is just one of many exciting new features introduced in ClusterControl v1.4. Do upgrade (or install ClusterControl if you haven’t used it yet), give it a try and let us know your thoughts. New installations come with a 30-days trial.
The videos below demonstrate the top features and functions included in ClusterControl.
Deploy
Deploy the best open source database for the job at hand using repeatable deployments with best practice configurations for MySQL, MySQL Cluster, Galera Cluster, Percona, PostgreSQL or MongoDB databases. Reduce time spent on manual provisioning and more time for experimentation and innovation.
Management
Easily handle and automate your day to day tasks uniformly and transparently across a mixed database infrastructure. Automate backups, health checks, database repair/recovery, security and upgrades using battle tested best practices.
Monitoring
Unified and comprehensive real-time monitoring of your entire database and server infrastructure. Gain access to 100+ key database and host metrics that matter to your operational performance. Visualize performance in custom dashboards to establish operational baselines and support capacity planning.
Scaling
Handle unplanned workload changes by dynamically scaling out with more nodes. Optimize resource usage by scaling back nodes.
ClusterControl
Single Console for Your Entire Database Infrastructure
MySQL replication setups can take different shapes. The main topology is probably a simple master-slave setup. But it is also possible to construct more elaborate setups with multiple masters and chained setups. ClusterControl 1.4 takes advantage of this flexibility and gives you possibility to deploy multimaster setups. In this blog post, we will look at a couple of different setups and how they would be used in real-life situations.
New Deployment Wizard
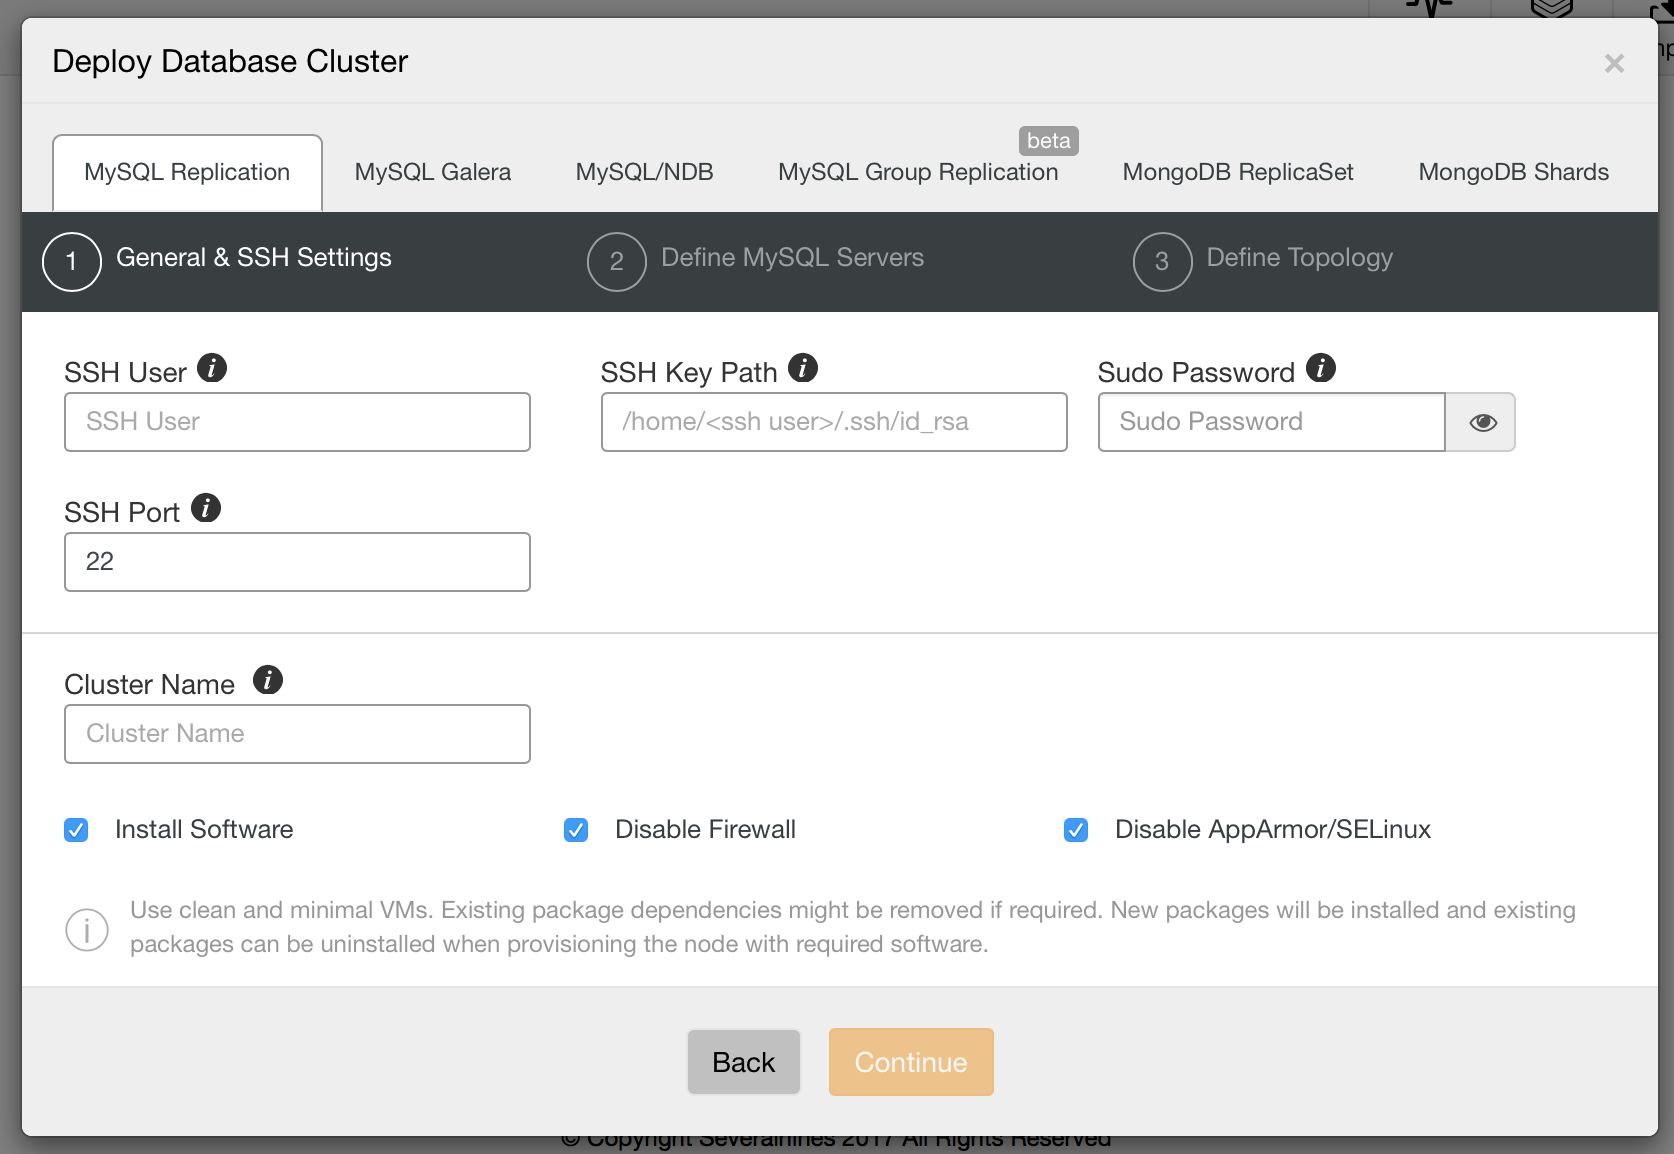
First of all, let’s take a look at the new deployment wizard in ClusterControl 1.4. It starts with SSH configuration: user, path to ssh key and whether you use sudo or not.
Image may be NSFW. Clik here to view.
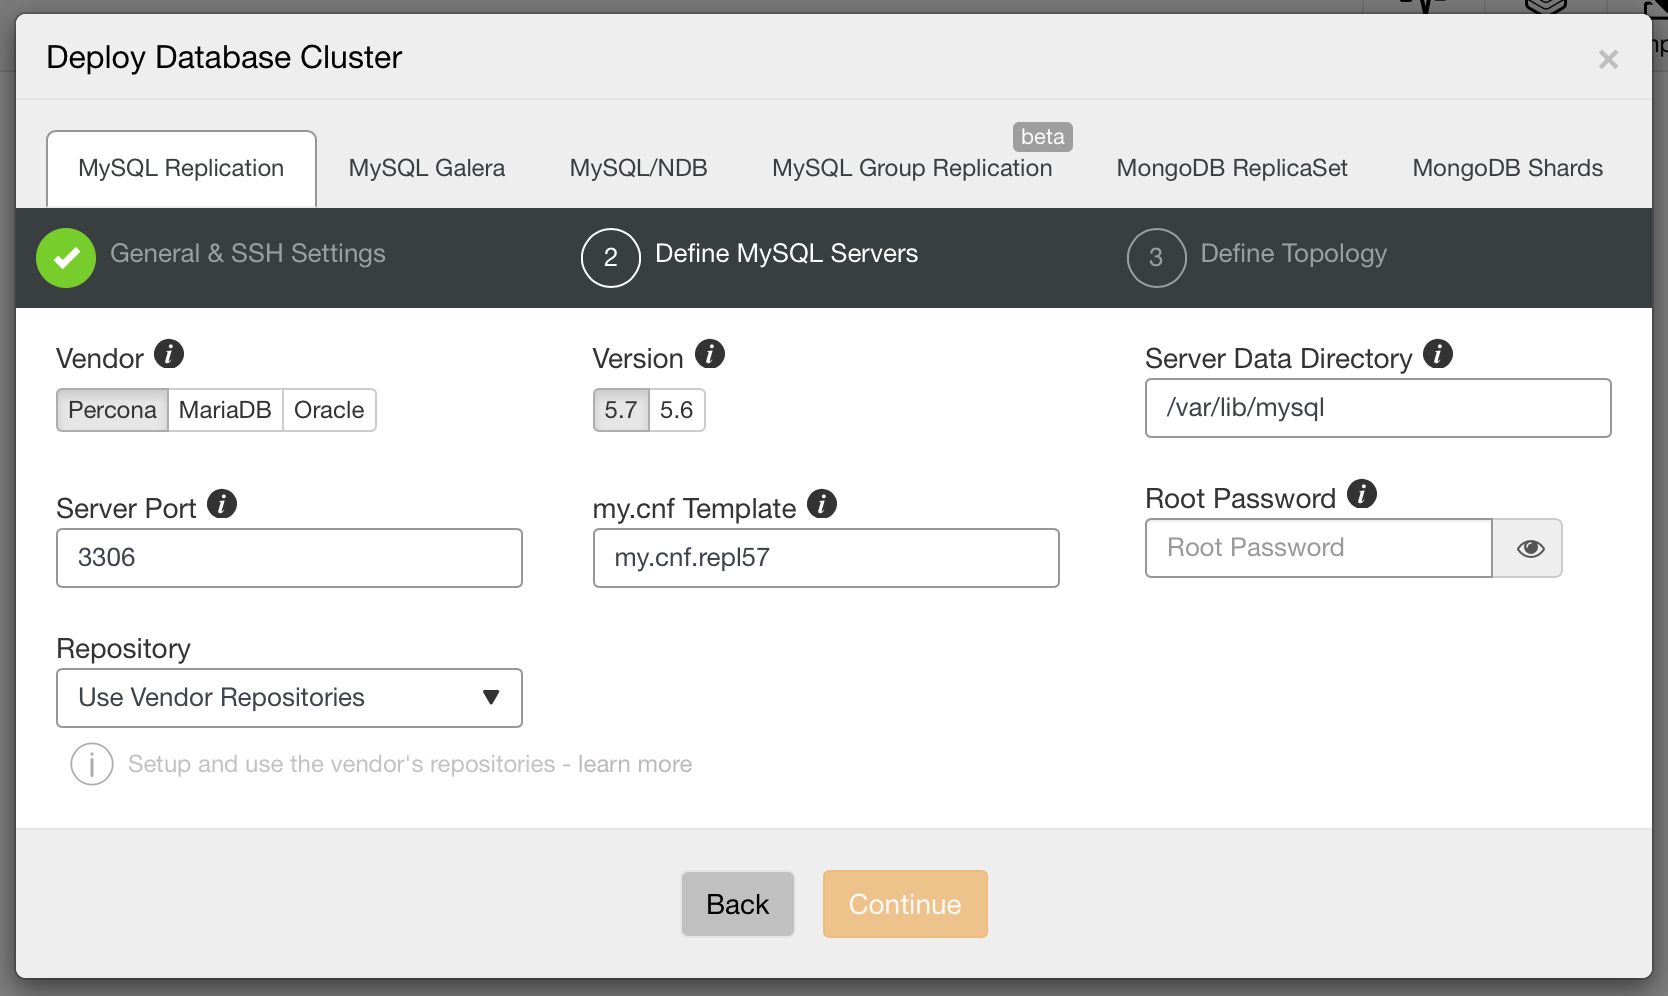
Next, we pick a vendor and version, data directory, port, configuration template, password for root user and, finally, from which repository ClusterControl should install the software.
Image may be NSFW. Clik here to view.
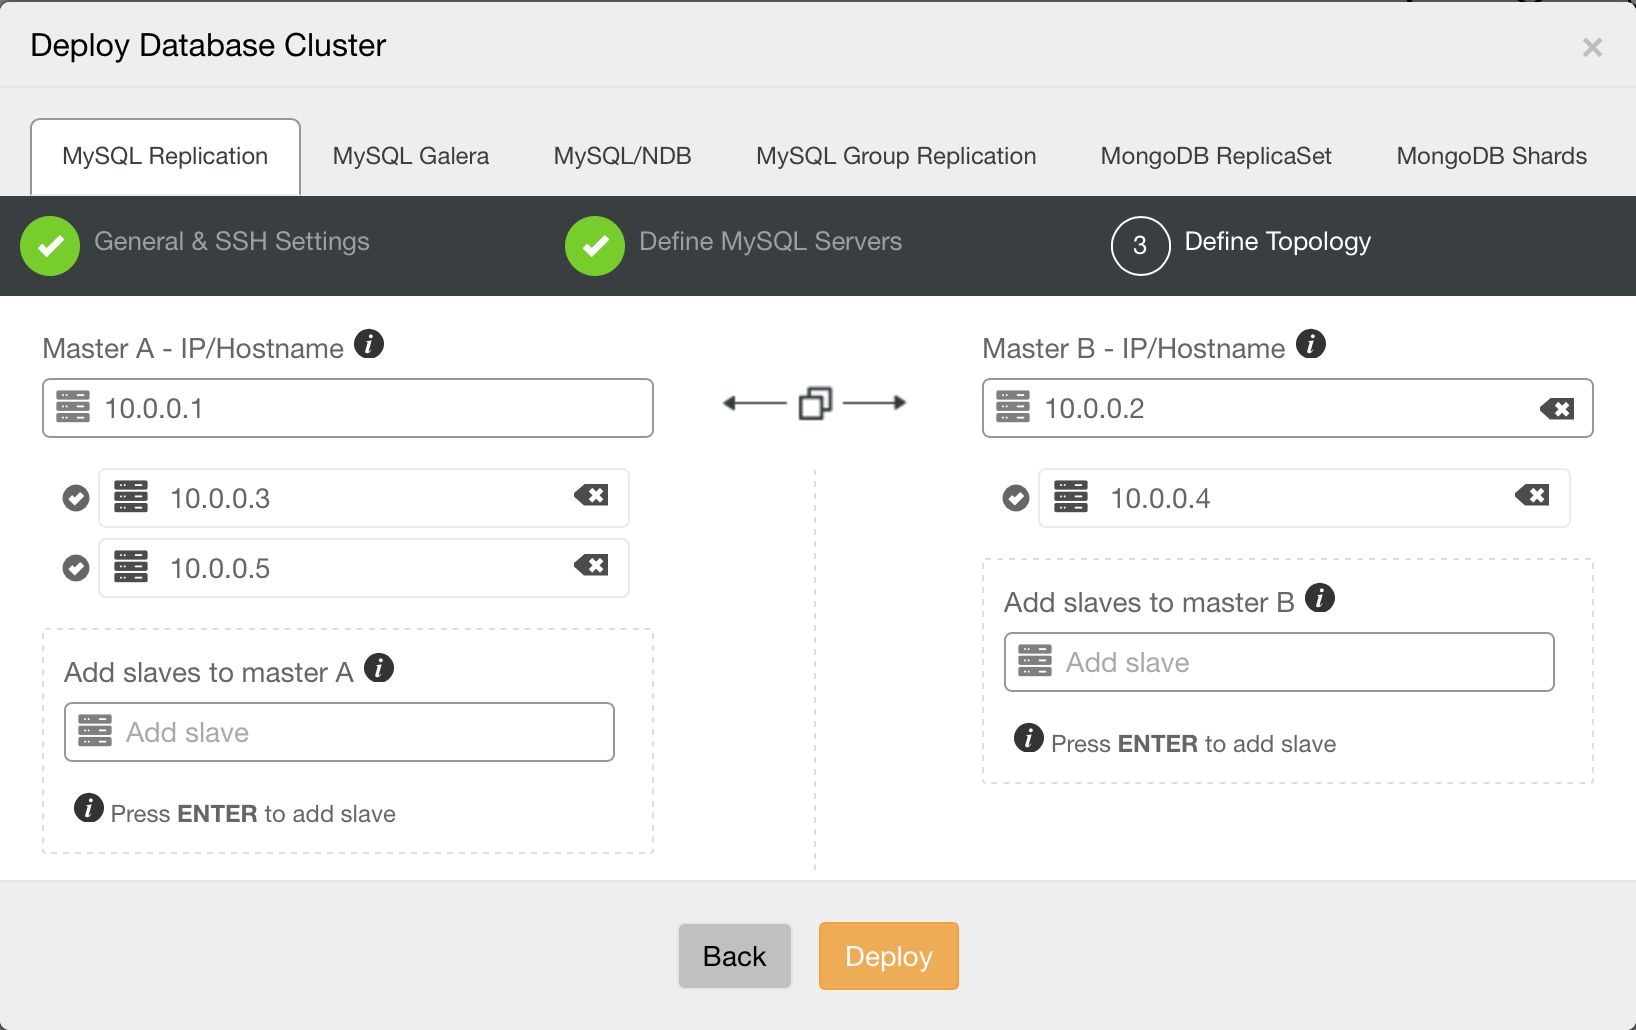
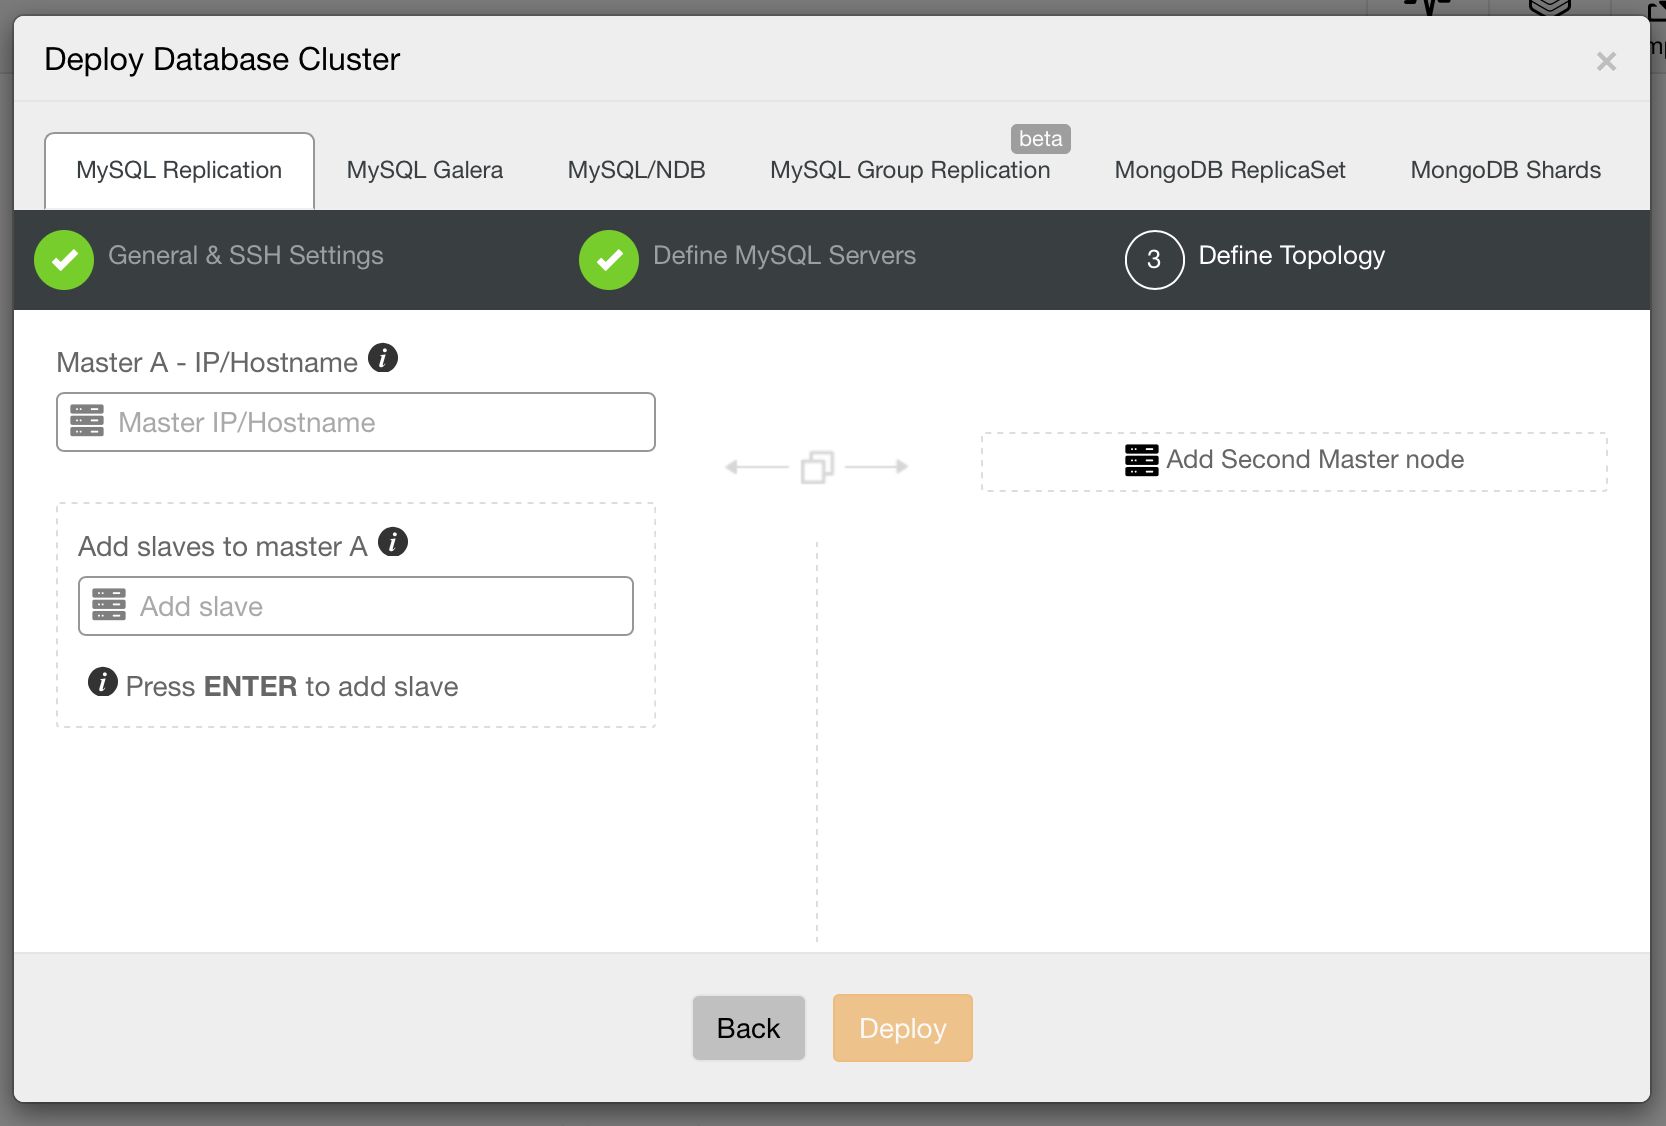
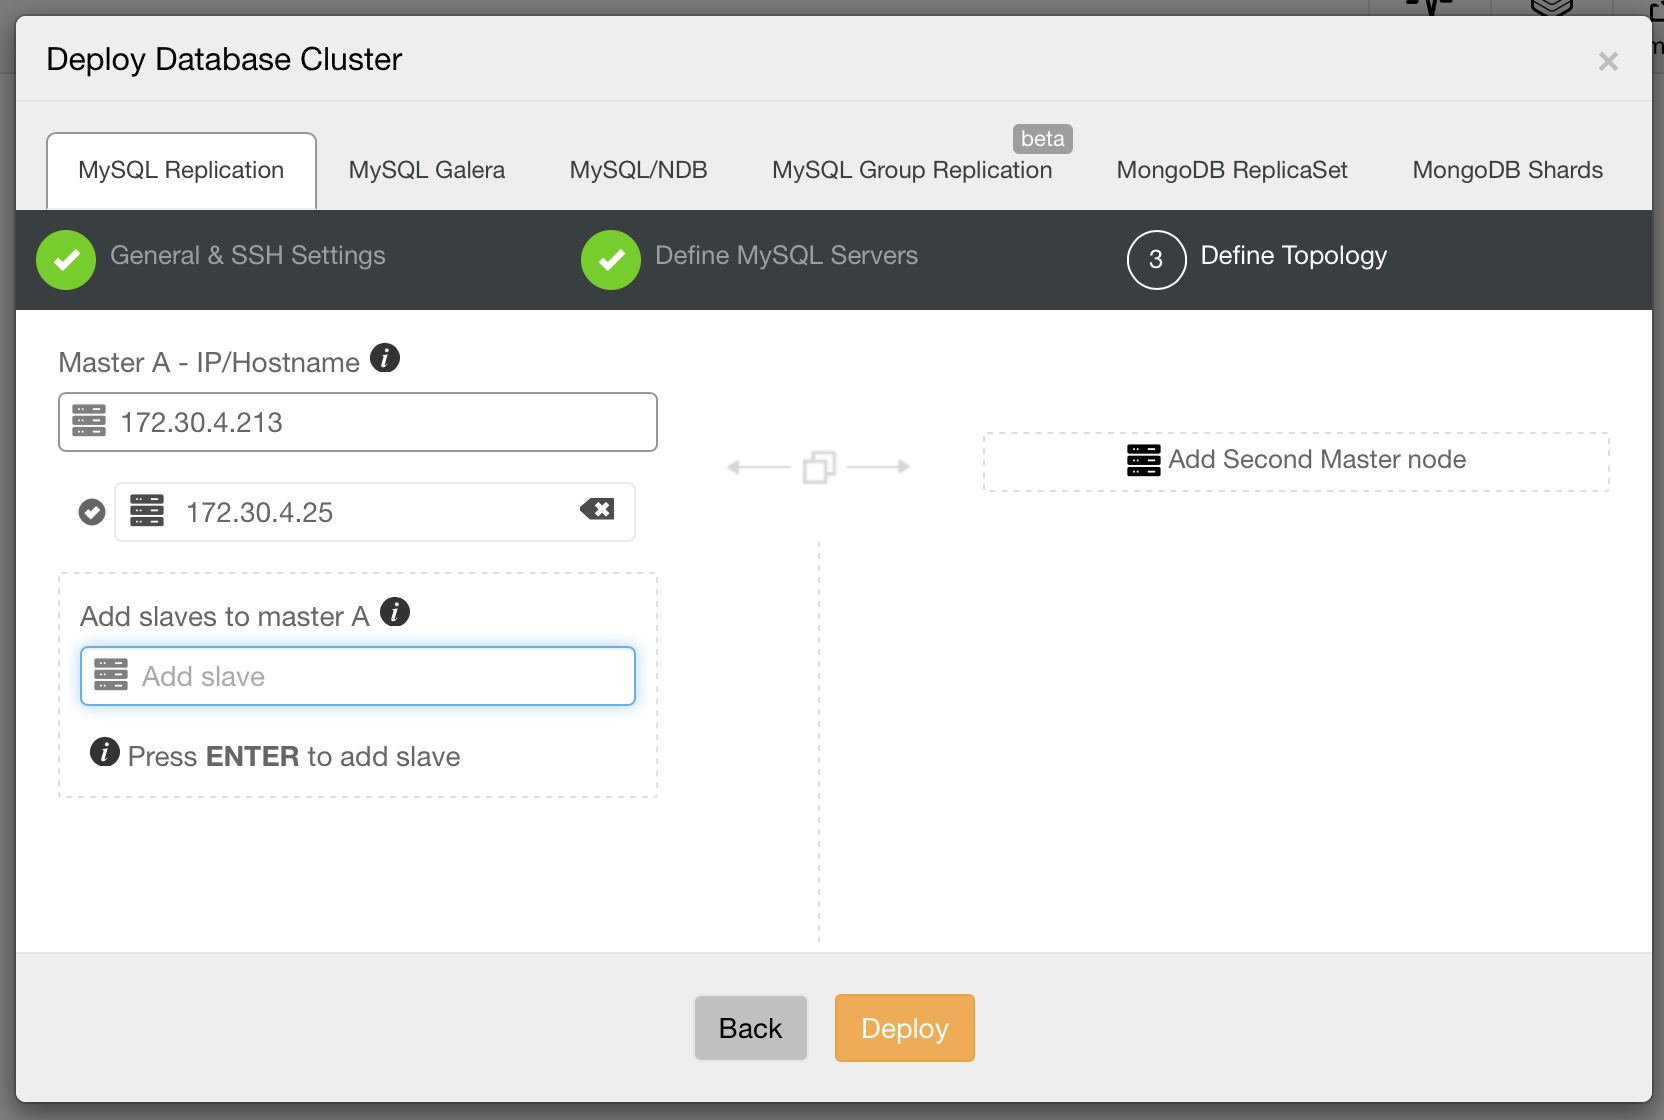
Then, the third and final step to define the topology.
Image may be NSFW. Clik here to view.
Let’s go through some of these topologies in more detail.
Master - slave topology
Image may be NSFW. Clik here to view.
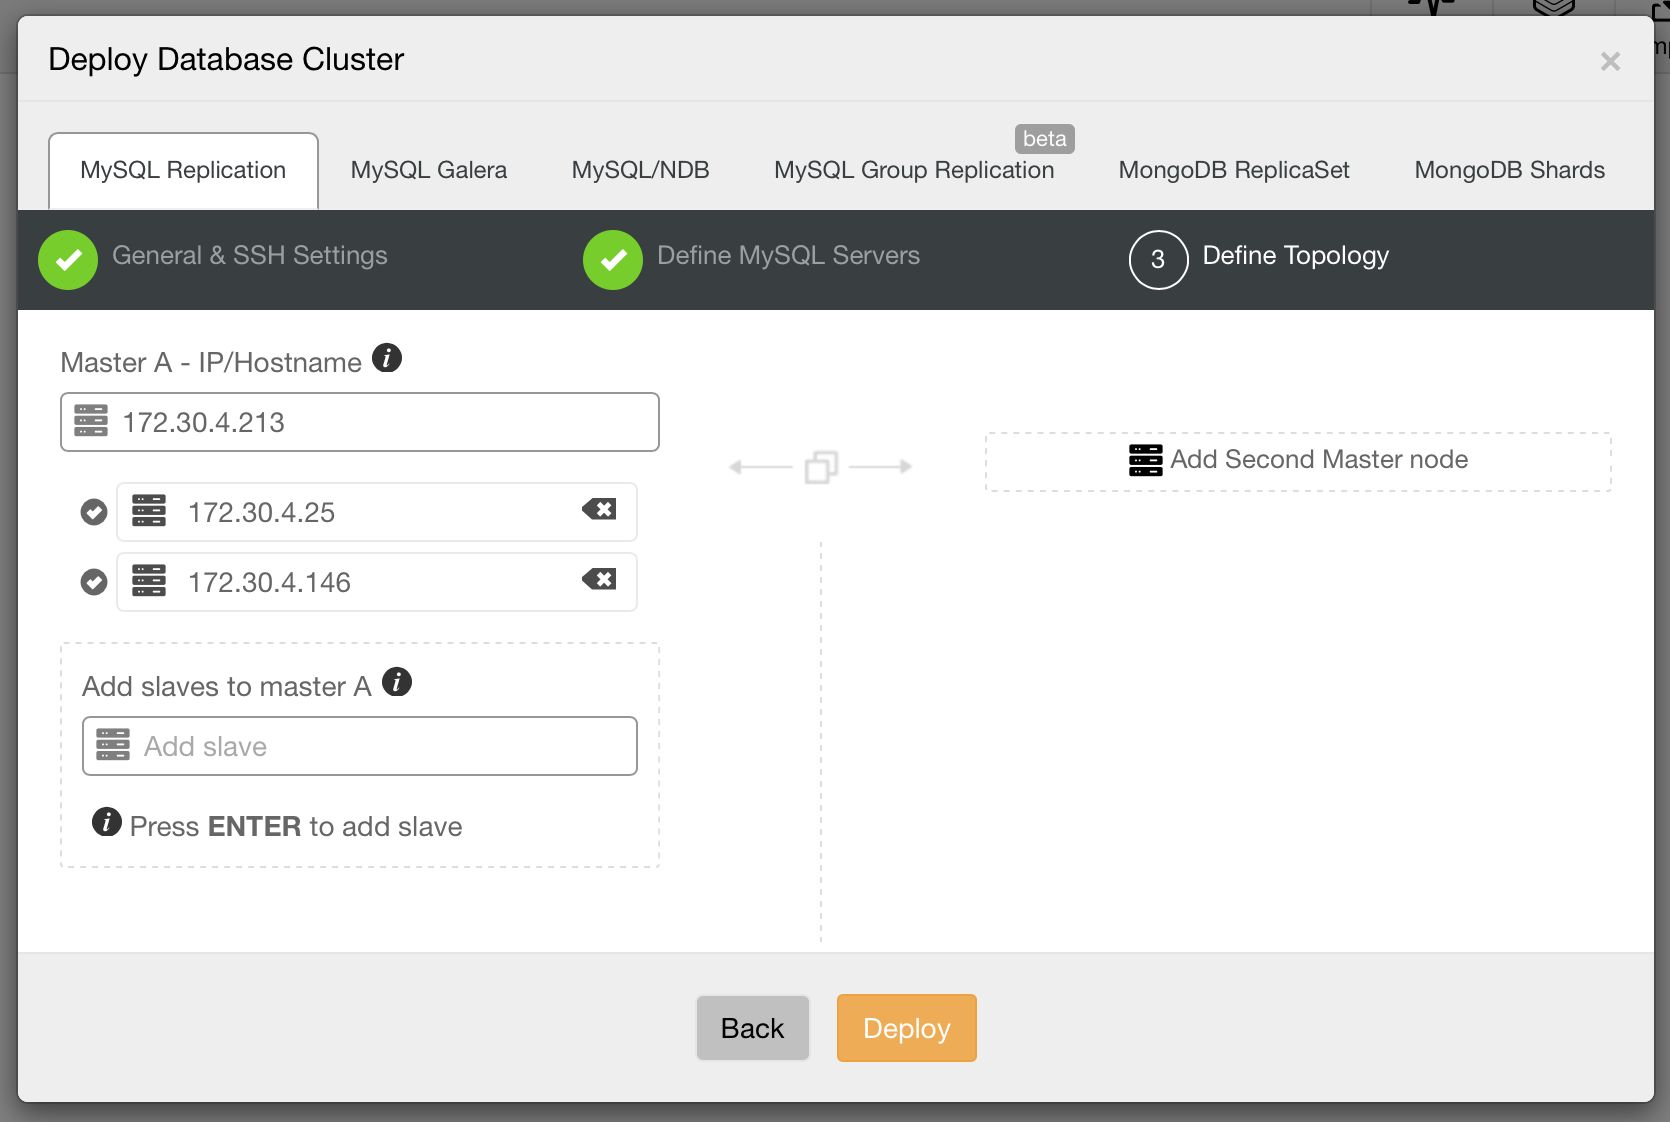
This is the most basic setup you can create with MySQL replication - one master and one or more slaves.
Image may be NSFW. Clik here to view.
Such configuration gives you scale-out for reads as you can utilize your slaves to handle read-only queries and transactions. It also adds some degree of high availability in your setup - one of slaves can be promoted to master in case the current master becomes unavailable. We introduced an automatic failover mechanism in ClusterControl 1.4.
The master - slave topology is widely used to reduce load on the master by moving reads to slaves. Slaves can also be used to handle specific types of heavy traffic - for instance, backups or analytics/reporting servers. This topology can also be used to distribute data across different datacenters.
When it comes to multiple datacenters, this might be useful if users are spread across different regions. By moving data closer to the users, you will reduce network latency.
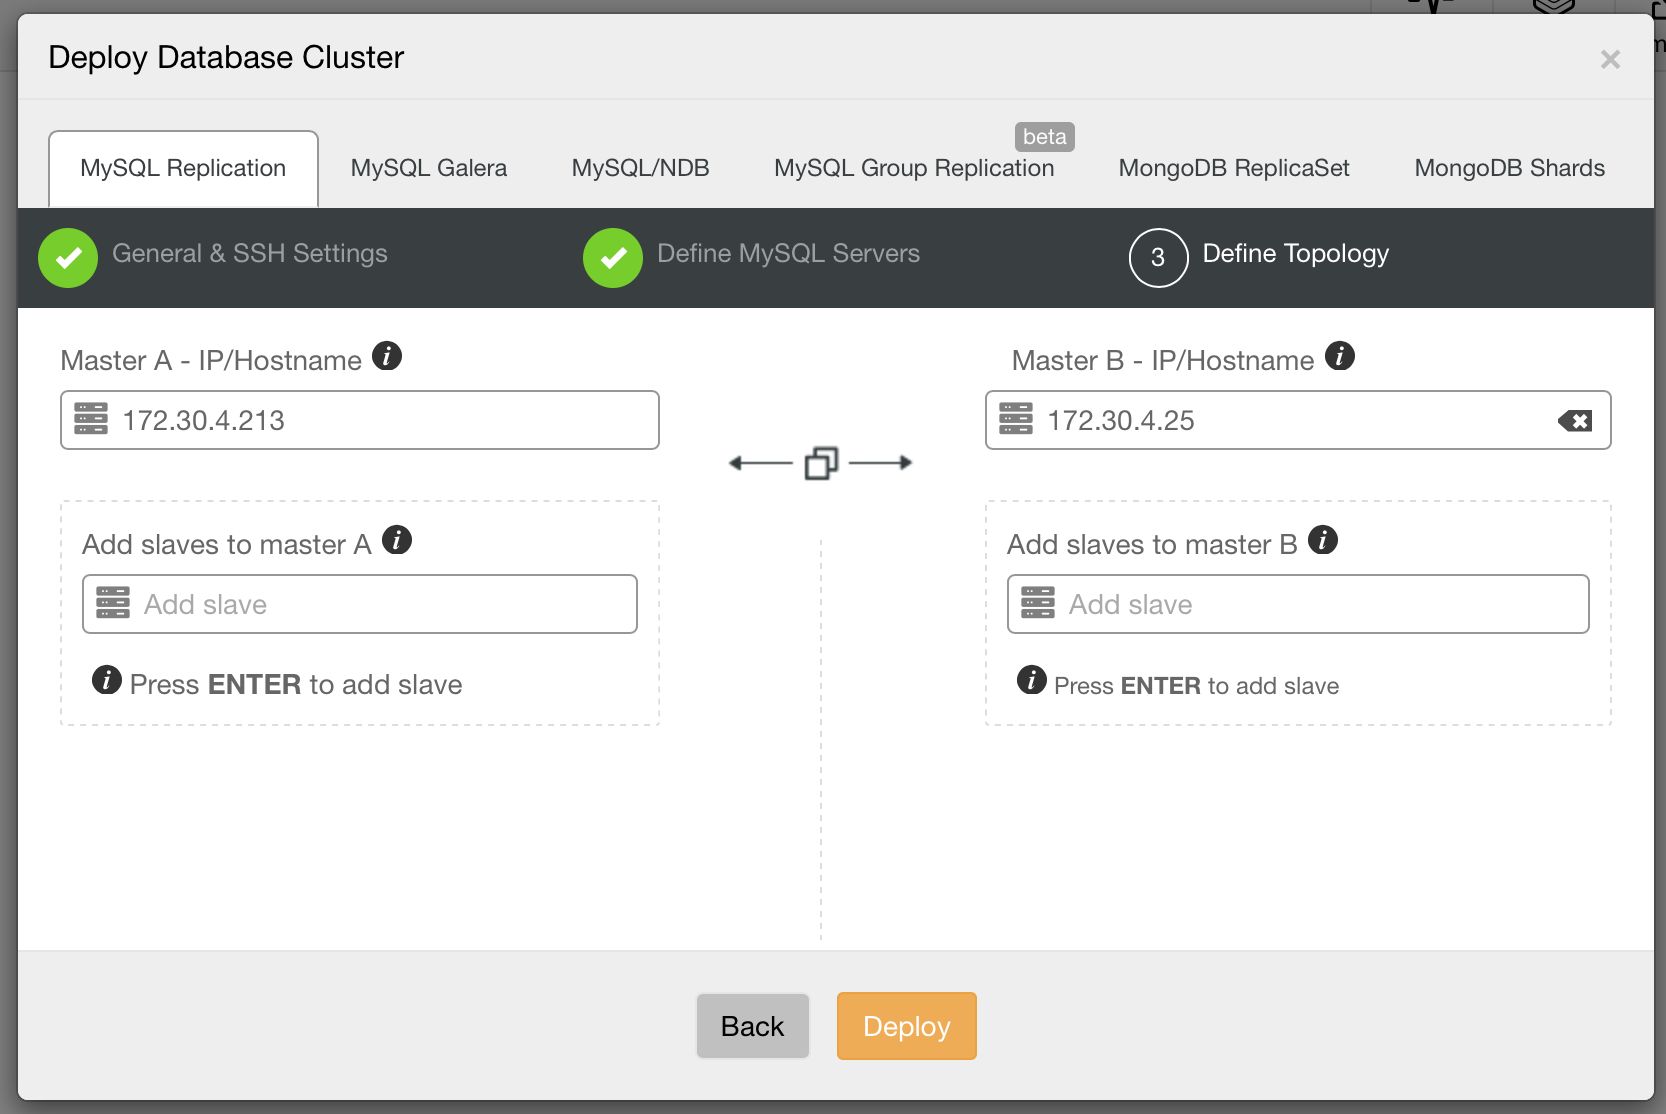
Master - master, active - standby
Image may be NSFW. Clik here to view.
This is another common deployment pattern - two MySQL instances replicating to each other. One of them is taking writes, the second one is in standby mode. This setup can be used for scale-out, where we use the standby node for reads. But this is not where its strength lies. The most common use case of this setup is to deliver high availability. When the active master dies, the standby master takes over its role and starts accepting writes. When deploying this setup, you have to keep in mind that two nodes may not be enough to avoid split brain. Ideally you’d use a third node, for example a ClusterControl host, to detect the state of the cluster. A proxy, collocated with ClusterControl, should be used to direct traffic. Colocation ensures that both ClusterControl (which performs the failover) and proxy (which routes traffic) see the topology in the same way.
You may ask - what is the difference between this setup and master-slave? One way or the other, a failover has to be performed when the active master is down. There is one important difference - replication goes both ways. This can be used to self-heal the old master after failover. As soon as you determine that the old master is safe to take a “standby” role, you can just start it and, when using GTID, all missing transactions should be replicated to it without need for any action from user.
This feature is commonly used to simplify site switchover. Let’s say that you have two site locations - active and standby/disaster recovery (DR). The DR site is designed to take over the workload when something is not right with the main location. Imagine that some issue hit your main datacenter, something not necessarily related to the database - for instance, a problem with block storage on your web tier. As long as your backup site is not affected, you can easily (or not - it depends on how your app works) switch your traffic to the backup site. From the database perspective, this is fairly simple process. Especially if you use proxies like ProxySQL which can perform a failover that is transparent to the application. After such failover, your writes hit the old standby master which now acts as active. Everything is replicated back to the primary datacenter. So when the problem is solved, you can switch the traffic back without much issues. The data in both datacenters are up-to-date.
It is worth noting that ClusterControl also supports active - active type of master - master setups. It does not deploy such topology as we strongly discourage users from writing simultaneously on multiple masters. It does not help you to scale writes, and is potentially very tricky to maintain. Still, as long as you know what you are doing, ClusterControl will detect that both masters have read_only=off and will treat the topology accordingly.
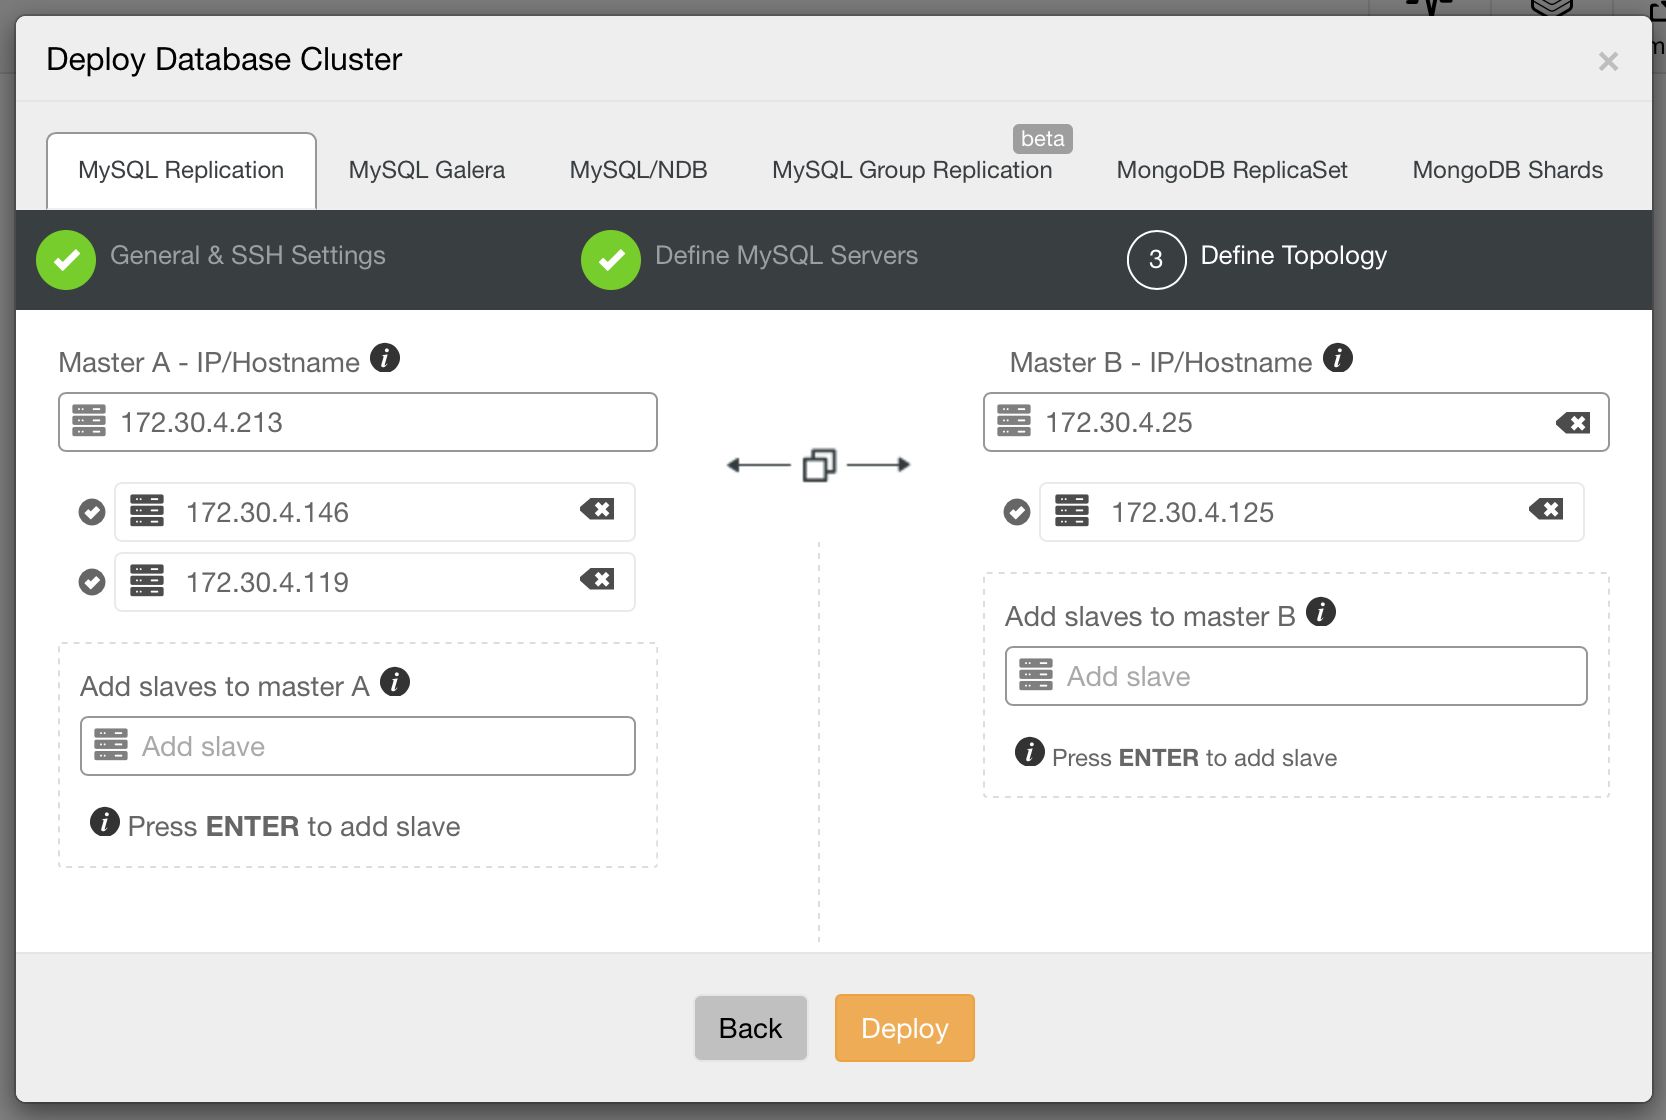
Master - master with slaves
Image may be NSFW. Clik here to view.
This is an extended version of the previous topology, it combines scale-out of master - slave(s) setup with easy of failover of master - master setup. Such complex setups are commonly used across datacenters, either forming a backup environment or being actively used for scale-out, keeping data close to the rest of the application.
Topology changes
Replication topologies are not static, they evolve with time. A slave can be promoted to master, different slaves can be slaving off different masters or intermediate masters. New slaves can be added. As you can see, deploying a replication topology is one thing. Maintaining it is something different. In ClusterControl 1.4, we added the ability to modify your topology.
Image may be NSFW. Clik here to view.
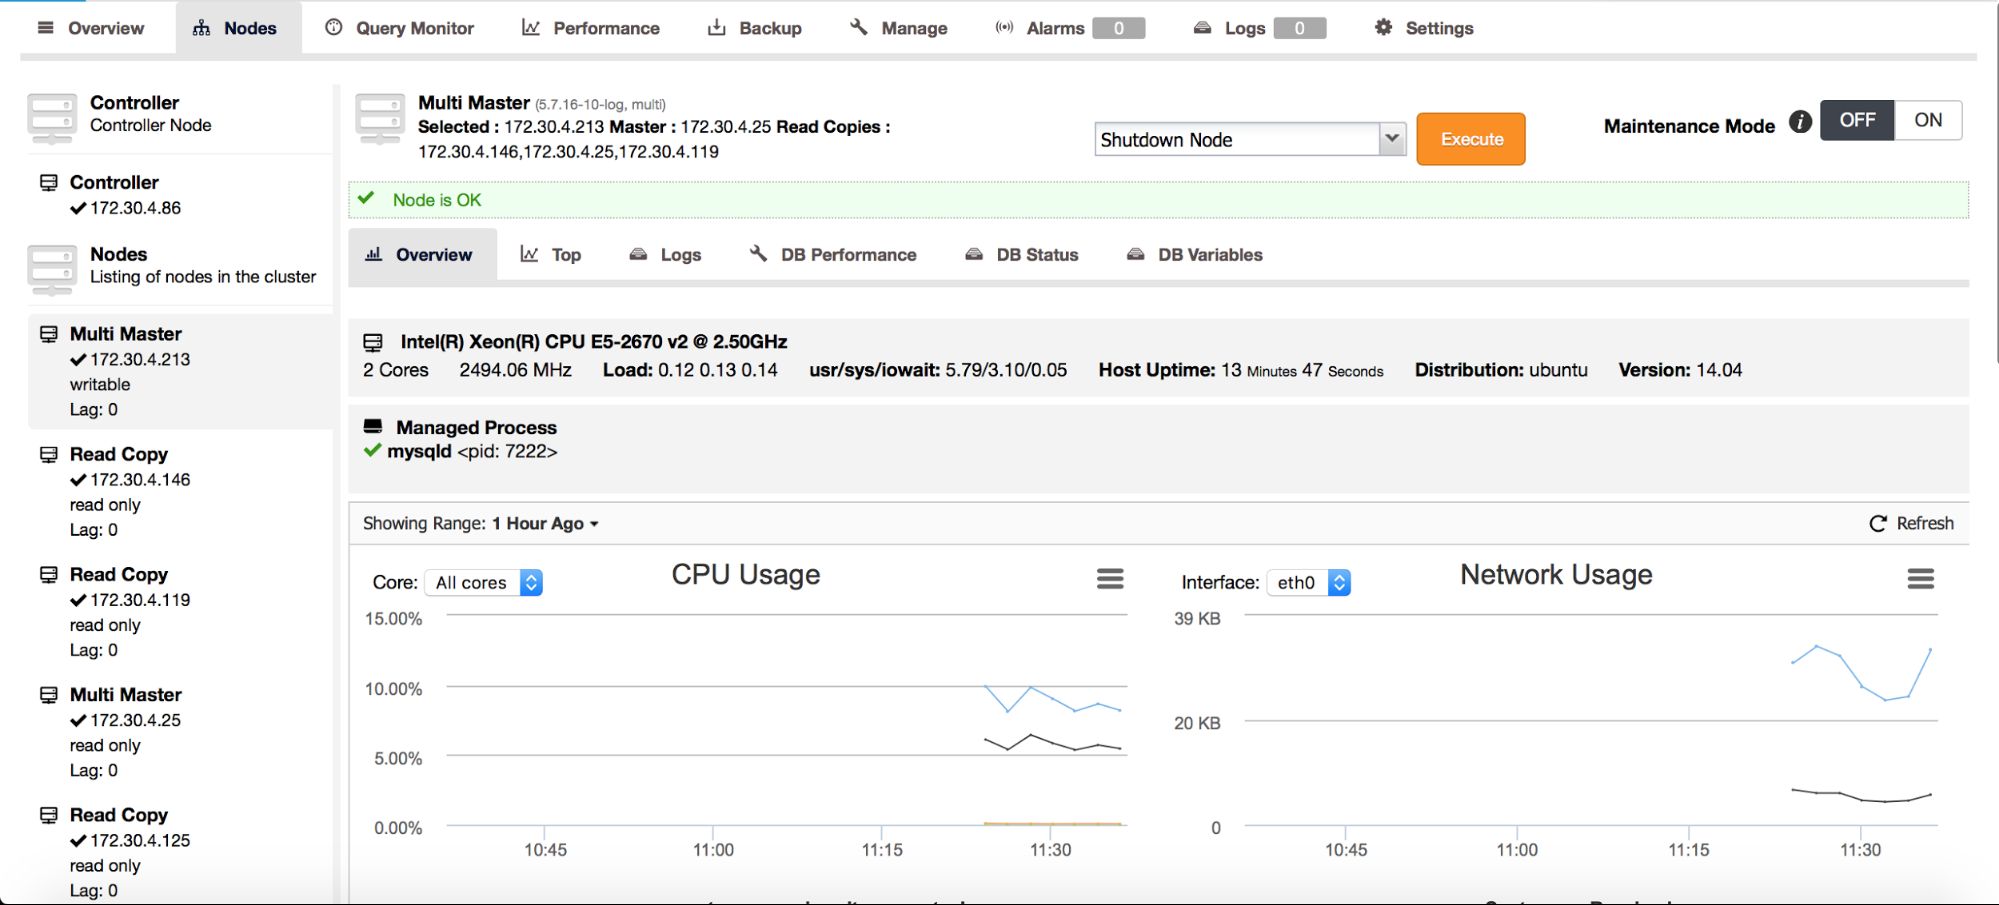
On the above screenshot, you can see how ClusterControl sees a master - master topology with a few slaves. On the left panel, you can see list of nodes and their roles. We can see two multi-master nodes out of which one is writable (our active master). We can also see list of slaves (read copies). On the main panel, you can see a summary for the highlighted host: its IP, IP of its master and IPs of its slaves.
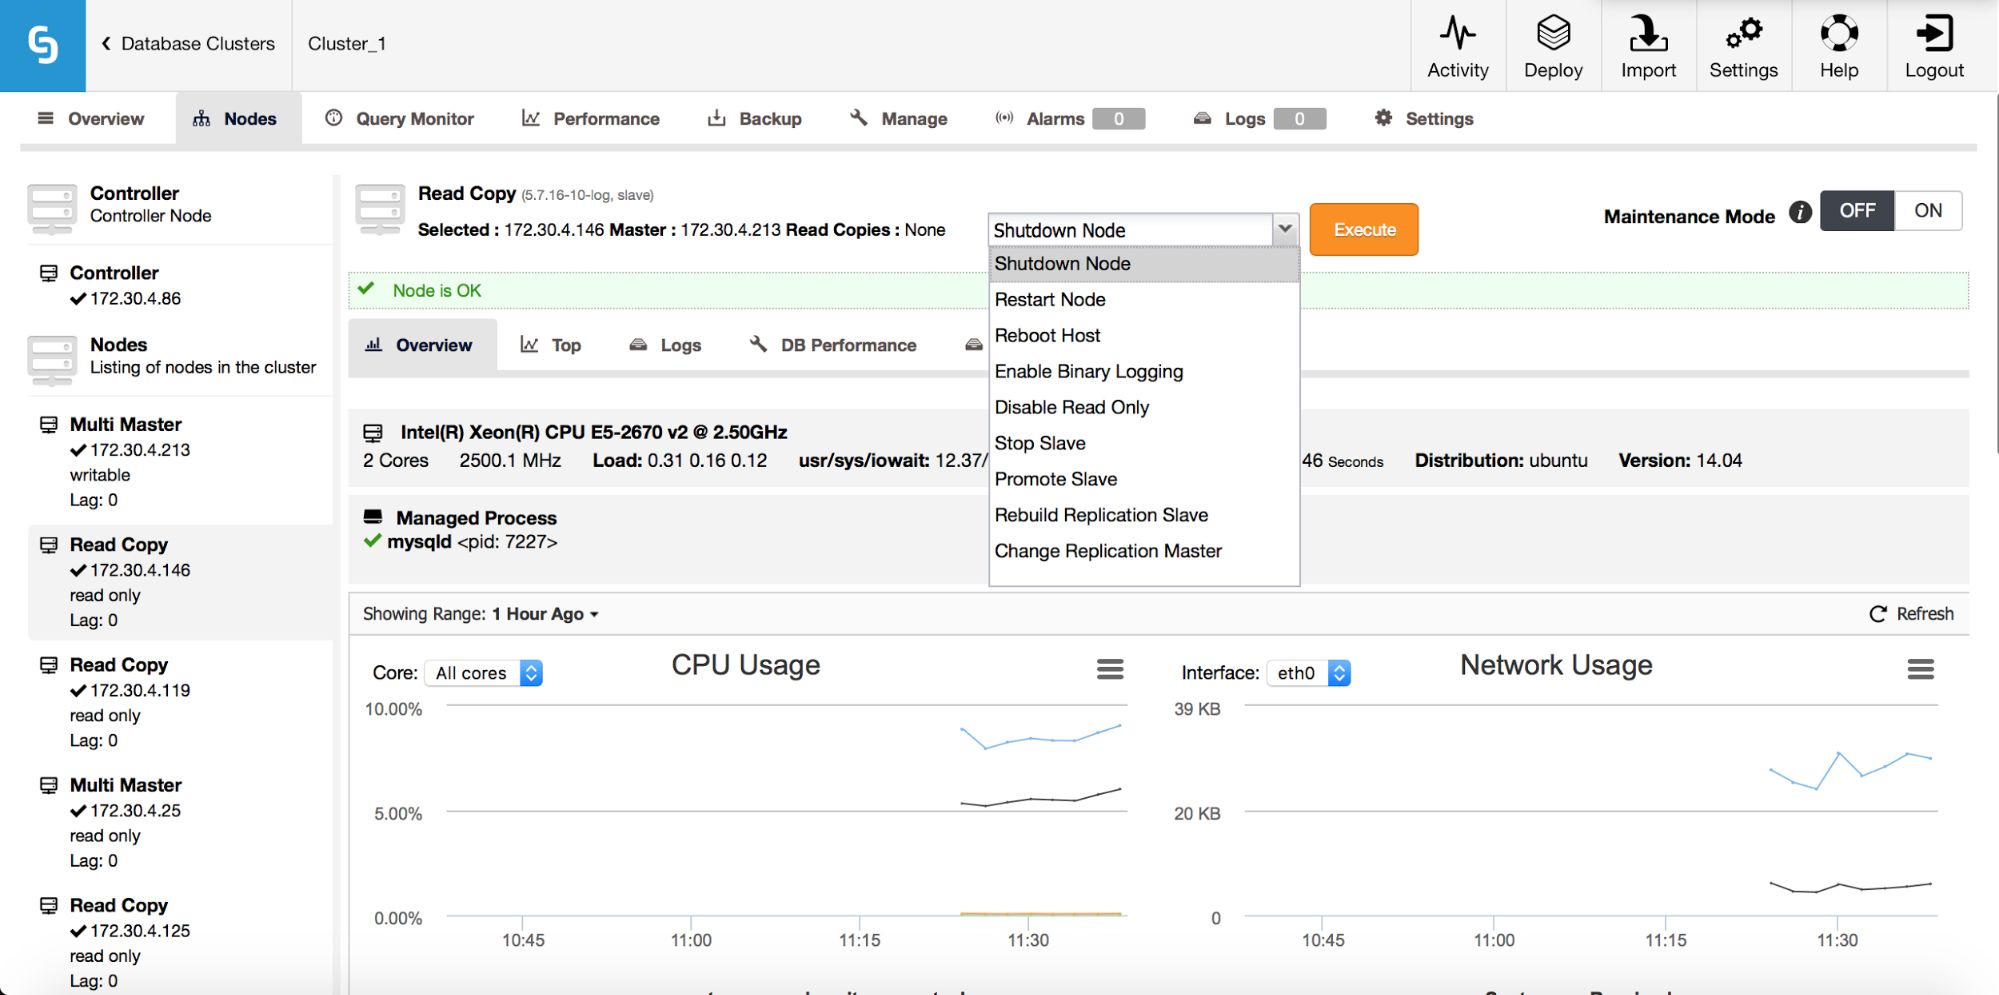
As we mentioned in our previous blog post, ClusterControl handles failover for you - it checks errant transactions, it lets slaves to catch up if needed. We still need a way to move our slaves around - you can find those options in the node’s drop-down list of actions:
Image may be NSFW. Clik here to view.
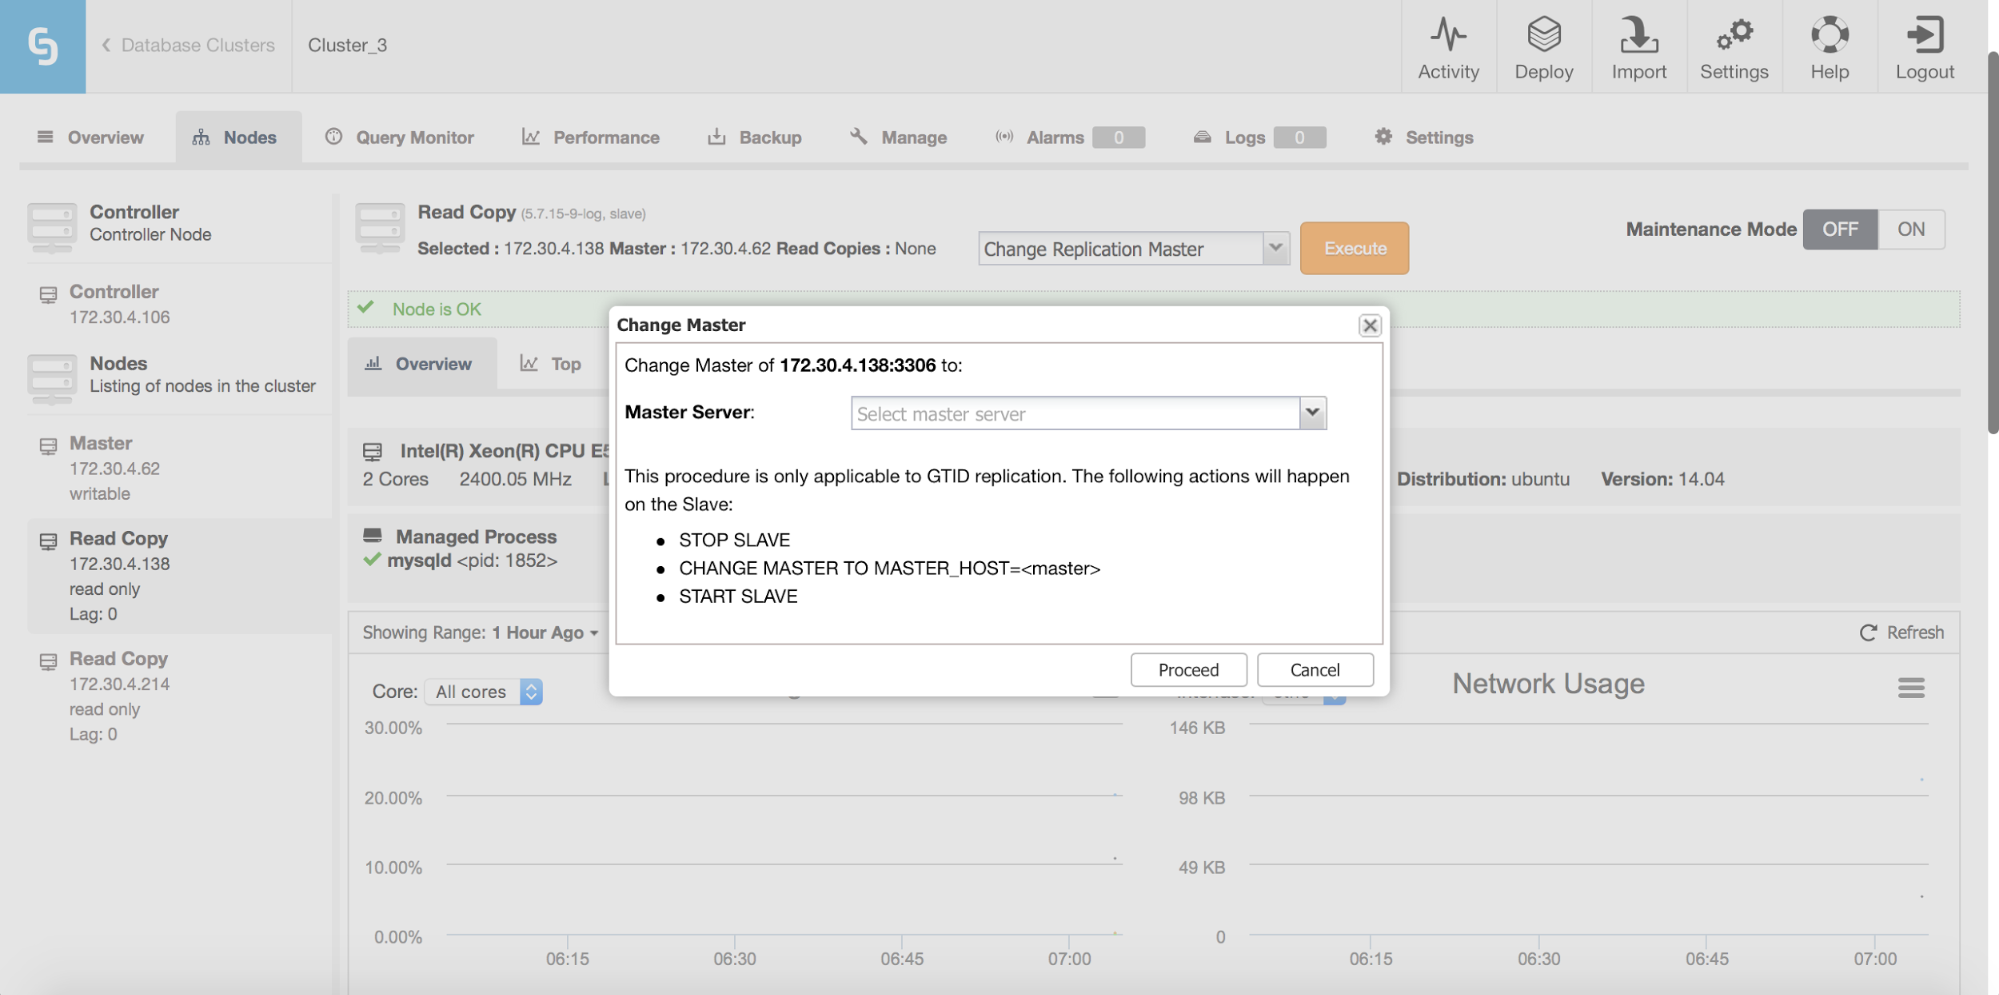
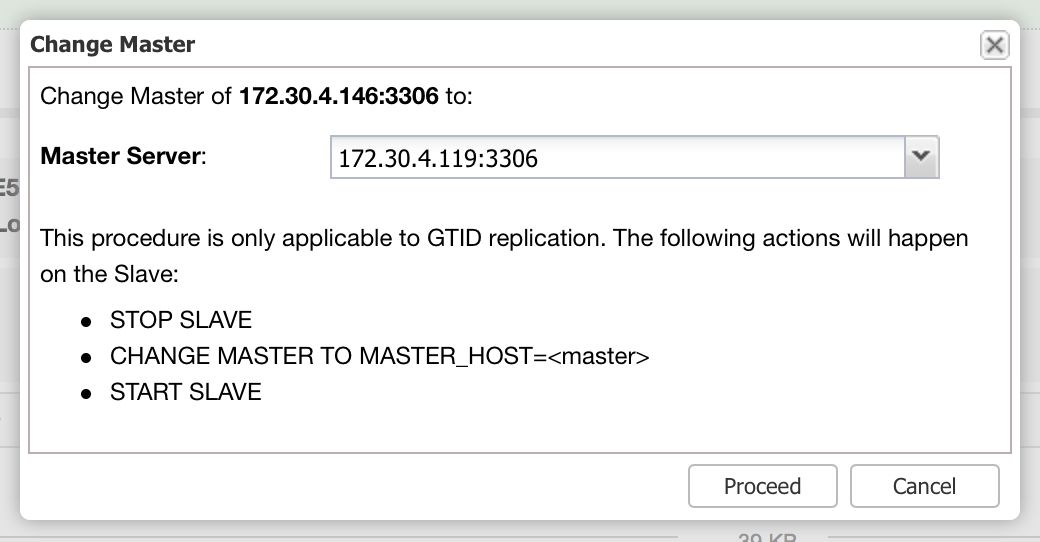
What we are looking for are: “Promote Slave”, which does what it says - the chosen slave will become a master (as long as there is nothing which would prevent it from happening) and the remaining hosts will slave off it. More commonly used will be “Change Replication Master”, which gives you a way to slave the chosen node off another MySQL master. Once you pick this job and “Execute” it, you’ll be presented with following dialog box:
Image may be NSFW. Clik here to view.
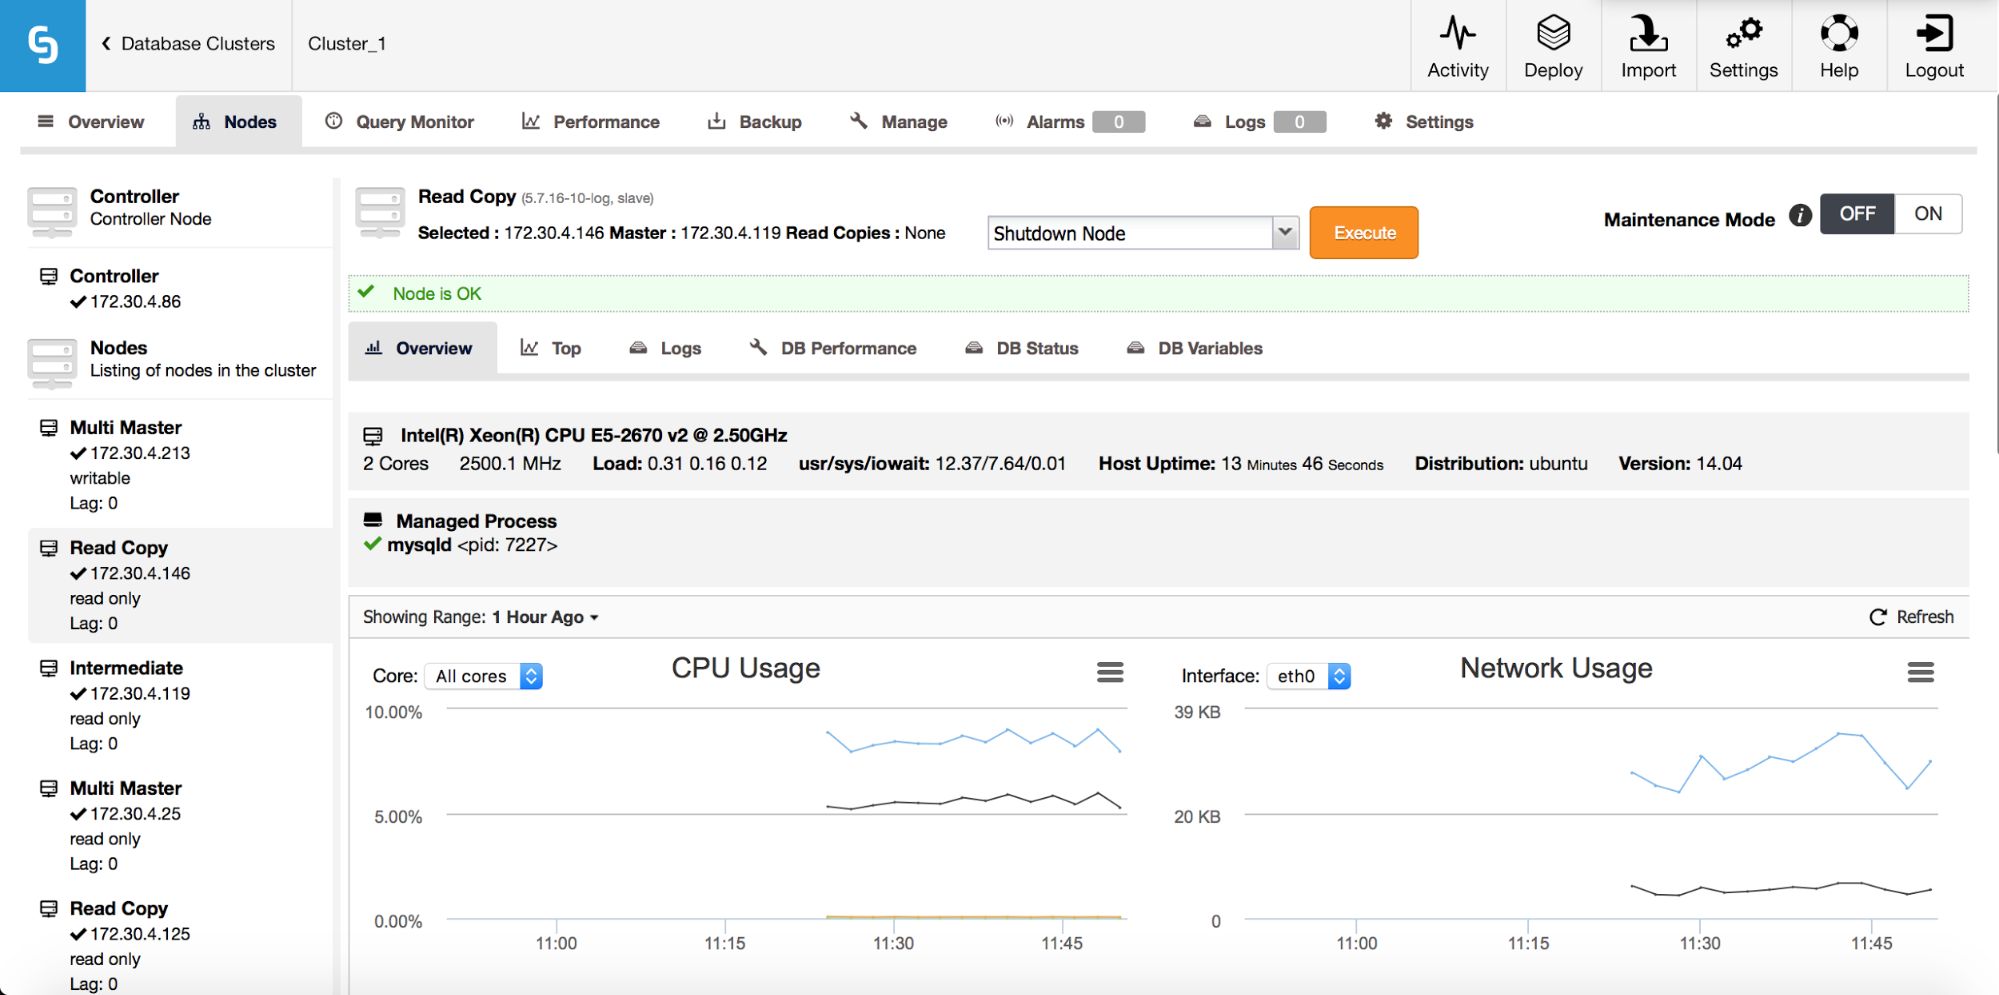
Here you need to pick a new master host for your node. Once that’s done, click “Proceed”. In our case, we picked the IP of one of the slaves which will end up as an intermediate master. Below you can see the status of our replication setup after reslaving finished. Please note that node 172.30.4.119 is marked as “Intermediate”. It’s worth noting that ClusterControl performs sanity checks when reslaving happens - it checks for errant transactions and ensures that the master switch won’t impact replication. You can read more about those safety measures in our blog post which covers failover and switchover process.
Image may be NSFW. Clik here to view.
As you can see, deploying and managing replication setups is easy with ClusterControl 1.4. We encourage you to give it a try and see how efficiently you can handle your setups. If you have any feedback on it, let us know as we’d love to hear from you.
ClusterControl
Single Console for Your Entire Database Infrastructure
Proxies are building blocks of high availability setups for MySQL and MariaDB. They can detect failed nodes and route queries to hosts which are still available. If your master failed and you had to promote one of your slaves, proxies will detect such topology changes and route your traffic accordingly. More advanced proxies can do much more: route traffic based on precise query rules, cache queries or mirror them. They can even be used to implement different types of sharding.
Introducing ProxySQL!
Join us for this live joint webinar with ProxySQL’s creator, René Cannaò, who will tell us more about this new proxy and its features. We will also show you how you can deploy ProxySQL using ClusterControl. And we will give you an early walk-through of some of the exciting ClusterControl features for ProxySQL that we have planned.
Date, Time & Registration
Europe/MEA/APAC
Tuesday, February 28th at 09:00 GMT (UK) / 10:00 CET (Germany, France, Sweden)
Demo of ProxySQL setup in ClusterControl (Krzysztof Książek)
Upcoming ClusterControl features for ProxySQL
Speakers
Image may be NSFW. Clik here to view.
René Cannaò, Creator & Founder, ProxySQL. René has 10 years of working experience as a System, Network and Database Administrator mainly on Linux/Unix platform. In the last 4-5 years his experience was focused mainly on MySQL, working as Senior MySQL Support Engineer at Sun/Oracle and then as Senior Operational DBA at Blackbird, (formerly PalominoDB). In this period he built an analytic and problem solving mindset and he is always eager to take on new challenges, especially if they are related to high performance. And then he created ProxySQL …
Image may be NSFW. Clik here to view.
Krzysztof Książek, Senior Support Engineer at Severalnines, is a MySQL DBA with experience managing complex database environments for companies like Zendesk, Chegg, Pinterest and Flipboard.
We look forward to “seeing” you there and to insightful discussions!
If you have any questions or would like a personalised live demo, please do contact us.
In anticipation of this month’s webinar MySQL & MariaDB Load Balancing with ProxySQL & ClusterControl that will happen on February 28th Severalnines sat down with the creator of ProxySQL founder and creator René Cannaò to discuss his revolutionary product, how it’s used, and what he plans to cover in the webinar. Watch the video or read the transcript below of the interview.
ClusterControl
Single Console for Your Entire Database Infrastructure
Hi I’m Forrest and I’m from the Severalnines marketing team and I’m here interviewing René Cannaò from ProxySQL. René thanks for joining me. Let’s start by introducing yourself, where did you come from?
Thank you, Forrest. Without going into too many details, I came from a system administrator background, and as a system administrator I got fascinated by databases, so I then become a DBA. In my past experience I worked as a Support Engineer for MySQL/Sun/Oracle, where I got of experience about MySQL... then remote DBA for PalominoDB and after that working as a MySQL SRE for Dropbox and I founded of ProxySQL.
So What is ProxySQL?
ProxySQL is a lightweight yet complex protocol aware proxy that sits between the MySQL clients and servers. I like to describe it as a gate, in fact the Stargate is the logo, so basically it separates clients from databases, therefore an entry point to access all the databases server.
Why did you create ProxySQL?
That’s a very interesting question, and very important. As a DBA, it was always extremely difficult to control the traffic sent to the database. This was the main reason to create ProxySQL: basically it’s a layer that separates the database from the application (de facto splitting them into two different layers), and because it’s sitting in the middle it’s able to control and manage all the traffic between the two, and also transparently managing failures.
So there are several database load balancers in the market, what differentiates ProxySQL from others?
First, most of the load balancers do not understand MySQL protocol: ProxySQL understands it, and this allows the implementation of features otherwise impossible to implement. Among the few proxies that are able to understand the MySQL protocol, ProxySQL is the only one designed from DBAs for DBAs, therefore it is designed to solve real issues and challenges as a DBA. For example, ProxySQL is the only proxy supporting connections multiplexing and query caching.
I noticed on your website that you say that ProxySQL isn’t battle-tested, its WAR-tested. What have you done to put ProxySQL through its paces?
The point is that from the very beginning ProxySQL was architected and designed to behave correctly in extremely demanding and very complex setups with millions of clients connections and thousands of database servers. Other proxies won’t be able to handle this. So, a lot of effort was invested in making sure ProxySQL is resilient in such complex setups. And, of course, no matter how resient it is set up it should not sacrifice performance.
On the 28th of February you will be co-hosting a webinar with Severalnines; with Krzysztof one or our Support Engineers. What are some of the topics you are going to cover at that event?
ProxySQL is built upon new technology data not present in other load balancers, its features and concepts are not always intuitive. Some concepts are extremely original in ProxySQL. For this reason the topics I plan to cover at the event are hostgroups, query rules, connection multiplexing, failures handling, and configuration management. Again, those are all the features and concepts that are only present in ProxySQL.
Excellent, well thank you for joining me, I’m really looking forward to this webinar on the 28th.
Today we’re happy to tell you about our release of ClusterControl for MongoDB, which completes our vision to let you fully manage MongoDB whether on premise or in the cloud. Our team has spent the last year developing a full array of expanded features for MongoDB to provide developers and DBAs an alternative system with which to securely deploy and manage their open source database infrastructures.
The ransom hack that’s been extensively covered in the press recently has shown a vulnerability in default deployments of MongoDB. For while it’s easy enough to get started with MongoDB, once installed, a good bit of manual configuration is needed; which is where security issues crept in. ClusterControl solves this for you by automatically providing the security you need to stay protected.
ClusterControl is used by enterprises with mission-critical environments worldwide, so you know you can depend on it for security and stability for your MongoDB infrastructures. And what’s more, it provides comparable functionality to existing ops managers at half the price.
Release Highlights
ClusterControl offers a rich set of features to securely deploy, monitor, manage and scale your MongoDB databases, including the following top 9 highlights.
Single Interface: ClusterControl provides one single interface to automate your mixed MongoDB, MySQL, and PostgreSQL database environments.
Easy Deployment: You can now automatically and securely deploy sharded MongoDB clusters or Replica Sets with ClusterControl’s free community version; as well as automatically convert a Replica Set into a sharded cluster if that’s required.
Advanced Security: ClusterControl removes human error and provides access to a suite of security features automatically protecting your databases from hacks and other threats.
Monitoring: ClusterControl provides a unified view of all sharded environments across your data centers and lets you drill down into individual nodes.
Scaling: Easily add and remove nodes, resize instances, and clone your production clusters with ClusterControl.
Management: ClusterControl provides management features that automatically repair and recover broken nodes, and test and automate upgrades.
Consistent Backups of Sharded Clusters: Using the Percona MongoDB Consistent Backup tool, ClusterControl allows you to make consistent snapshots of your MongoDB sharded clusters.
Advisors: ClusterControl’s library of Advisors allows you to extend the features of ClusterControl to add even more MongoDB management functionality.
Developer Studio: The ClusterControl Developer Studio lets you customize your own MongoDB deployment to enable you to solve your unique problems.
Extending our support for MongoDB, the rising star in the open source database world, has brought sharded clusters in addition to replica sets. This meant we had to retrieve more metrics to our monitoring, add advisors and provide consistent backups for sharding. As a result, you can now convert a ReplicaSet cluster to a sharded cluster, add or remove shards from a sharded cluster as well as add Mongos/routers to a sharded cluster.
On the new Severalnines database advisors for MongoDB
Advisors are mini-programs for specific database issues and we’ve added three new advisors for MongoDB in the latest ClusterControl release. The first one calculates the replication window, the second watches over the replication window, and the third checks for un-sharded databases/collections. In addition to this, we’ve also added a generic disk advisor. This advisor verifies if any optimizations can be done, like noatime and noop I/O scheduling, on the data disk that is being used for storage.
The growing number of cyberattacks on open source database deployments highlights the industry’s poor administrative and operational practices.
If 2016 taught us anything, it was the importance of sound operational practices and security measures in open source database deployments. For several years, researchers had warned about publicly exposed databases - with estimates ranging in the tens of thousands of servers. If the scale of the problem had not been apparent or frightening, well it surely is now.
Recently, ransomware groups deleted over 10,000 MongoDB databases within just a few days. Other open source databases (ElasticSearch, Hadoop, CouchDB) were also hit. Meanwhile, the number of exposed databases has gone up to about 100,000 instances.
What has led to this? Open source databases, and open source software in general, power a significant portion of today’s online services. Thanks to the increased use of agile development lifecycles, the cloud has become home to a variety of applications that are quickly deployed. Many businesses have also moved beyond using the cloud for non-critical functions, and now rely on the cloud for storing valuable data. This means more databases are being deployed in public clouds, in environments that are directly exposed to the Internet.
MongoDB in particular is very popular amongst developers, because of its convenience and expediency. But here’s the problem - quickly spinning up an environment for development is not the same thing as setting up for live production. They both demand very different levels of expertise. Thousands of database instances were not secured, and anyone could get read and write access to the databases (including any sensitive data) without any special tools or without having to circumvent any security measures. This is not a lapse of concentration from a few individuals that got us here, we’re facing a problem which is more widespread than anyone could imagine. We need to recognise that finding the middle ground between ease of use, speed of deployment and operational/security readiness is hard to find. So this begs the question - how can we collectively get beyond this type of problem?
If we could train every single individual who deploys MongoDB into a deployment engineer, it might help. At least, there will be some level of protection so not just anyone can walk in through an open door.
Operations is not rocket science, but it might not be reasonable to expect all developers, who are the primary users of MongoDB, to turn into full-fledged systems/deployment engineers. The IT industry is moving towards faster, leaner implementations and deployment of services. The middle ground between ease of use, deployment speed and sound operational practices might seem even further away. Automation might just be the thing that helps us find that middle ground.
ClusterControl
Single Console for Your Entire Database Infrastructure
Database configurations suitable for production tend to be a bit more complex, but once designed, they can be duplicated many times with minimal variation.
Automation can be applied to initial provisioning and configuration, as well as ongoing patching, backups, anomaly detection and other maintenance activities. This is the basis for our own automation platform for MongoDB, ClusterControl. A well deployed and managed system can mitigate operational risk, and would certainly have prevented these thousands of databases from getting hacked.
Database ops management consists of 80% reading and interpreting your monitoring systems. Hundreds of metrics can be interpreted and combined in various ways to give you deep insights into your database systems and how to optimize them. When running multiple database systems, the monitoring of these systems can become quite a chore. If the interpretation and combination of metrics takes a lot of time, wouldn’t it be great if this could be automated in some way?
This is why we created database advisors in ClusterControl: small scripts that can interpret and combine metrics for you, and give you advice when applicable. For MySQL we have created an extensive library of the most commonly used MySQL monitoring checks. But also for MongoDB we have a broad library of advisors to your disposal. For this blog post, we have picked the nine most important ones for you. We’ll describe each and every one of them in detail.
The nine MongoDB advisors we will cover in this blog post are:
Disk mount options check
Numa check
Collection lock percentage (MMAP)
Replication lag
Replication Window
Un-sharded databases and collections (sharded cluster only)
Authentication enabled check
Authentication/authorization sanity check
Error detection (new advisor)
Disk mount options advisor
It is very important to have your disks mounted in the most optimal way. With the ClusterControl disk mount options advisor, we look more closely at your data disk on a daily basis. In this advisor, we investigate the filesystem used, mount options and the io scheduler settings of the operating system.
We check if your disks have been mounted with noatime and nodiratime. Setting these will decrease the performance of the disks, as on every access to a file or directory the access time has to be written to disk. Since this happens continuously on databases, this is a good performance setting and also increases the durability of your SSDs.
For file systems we recommend to use modern file systems like xfs,zfs,ext4 or btrfs. These file systems are created with performance in mind. The io scheduler is advised to be either on noop or deadline.Deadline has been the default for databases for years, but thanks to faster storage like SSDs the noop scheduler is making more sense nowadays.
Numa check advisor
For MongoDB we enable our NUMA check advisor. This advisor will check if NUMA (Non-Uniform Access Memory) has been enabled on your system, and if this is the case, to switch it off.
When Non-Uniform Access Memory has been enabled, the CPU of the server is only able to address its own memory directly and not the other CPUs in the machine. This way the CPU is only able to allocate memory from its own memory space, and allocating anything in excess will result in swap usage. This architecture has a strong performance benefit on multi-processor applications that allocate all CPUs, but as MongoDB isn’t a multi-processor application it will decrease the performance greatly and could lead to huge swap usage.
Collection lock percentage (MMAP)
As MMAP is a file based storage system, it doesn’t support the document level locking as found in WiredTiger and RocksDB. Instead the lowest level of locking for MMAP is the collection locks. This means any writes to a collection (insert, update or delete) will lock the entire collection. If the percentage of locks is getting too high, this indicates you have contentions problems on the collection. When not addressed properly, this could bring your write throughput to a grinding halt. Therefore having an advisor warning you up front is very helpful.
MongoDB Replication Lag advisor
If you are scaling out MongoDB for reads via secondaries, the replication lag is very important to keep an eye on. The MongoDB client drivers will only use secondaries that don’t lag too far behind, else you may risk serving out stale data.
Inside MongoDB the primary will keep track of the replication status of its secondaries. The advisor will fetch the replication information and guards the replication lag. If the lag becomes too high it will send out a warning or critical status message.
MongoDB Replication Window advisor
Next to replication lag, the replication window is an important metric to watch. The MongoDB oplog is a single collection, that has been limited in a (preset) size. Once the oplog reaches the end and a new transaction needs to be stored, it will evict the oldest transaction to make room for the new transaction. The replication window reflects the number of seconds between the oldest and newest transaction in the oplog.
This metric is very important as you need to know for how long you can take a secondary out of the replicaSet, before it will no longer be able to catch up with the master due to being too far behind in replication. Also if a secondary starts lagging behind, it would be good to know how long we can tolerate this before the secondary is no longer able to catch up.
In the MongoDB shell, a function is available to calculate the replication window. This advisor in ClusterControl uses the function to make the same calculation. The benefit would be that you now can be alerted on a too short replication window.
ClusterControl
Single Console for Your Entire Database Infrastructure
MongoDB un-sharded databases and collections advisor
In a sharded MongoDB cluster, all un-sharded databases and collections are assigned to a default primary shard by the MongoDB shard router. This primary shard can vary between the databases and collections, but in general this would be the shard with the most disk space available.
Having a un-sharded database or collection doesn’t immediately pose a risk for your cluster. However if an application or user starts to write large volumes of data to one of these, the primary shard could fill up quickly and create an outage on this shard. As the database or collection is not sharded, it will not be able to make use of other shards.
Because of this reason we have created an advisor that will prevent this from happening. The advisor will scan all databases and collections, and warn you if it has not been sharded.
Authentication enabled check
Without enabling authentication in MongoDB, any user logging in will be treated as an admin. This is a serious risk as normally admin tasks, like creating users or making backups, now have become available to anyone. This combined with exposed MongoDB servers, resulted in the recent MongoDB ransom hacks, while a simple enabling of authentication would have prevented most of these cases.
We have implemented an advisor that verifies if your MongoDB servers have authentication enabled. This can be done explicitly by setting this in the configuration, or implicitly by enabling the replication keyfile. If this advisor fails to detect the authentication has been enabled you should immediately act upon this, as you server is vulnerable to be compromised.
Next to the authentication enabled advisor, we also have built an advisor that performs a sanity check for both authentication and authorization in MongoDB.
In MongoDB the authentication and authorization is not placed in a central location, but is performed and stored on database level. Normally users will connect to the database, authenticating against the database they intend to use. However, with the correct grants, it is also possible to authenticate against other (unrelated) databases and still make use of another database. Normally this is perfectly fine, unless a user has excessive rights (like the admin role) over another database.
In this advisor, we verify if these excessive roles are present, and if they could pose a threat. We also check at the same time for weak and easy to guess passwords.
Error detection (new advisor)
In MongoDB, any error encountered will be counted or logged. Within MongoDB there is a big variety of possible errors: user asserts, regular asserts, warnings and even internal server exceptions. If there are trends in these errors, it is likely that there is either a misconfiguration or an application issue.
This advisor will look at the statistics of MongoDB errors (asserts) and makes sense of this. We interpret the trends found and advice on how to decrease errors in your MongoDB environment!
In this webinar we will walk you through the essential steps necessary to secure MongoDB and how to verify if your MongoDB instance is safe.
How to secure MongoDB with ClusterControl
The recent MongoDB ransom hijack caused a lot of damage and outages, which could have been prevented with maybe two or three simple configuration changes. MongoDB offers a lot of security features out of the box, however it disables them by default.
In this webinar, we will explain which configuration changes are necessary to enable MongoDB’s security features, and how to test if your setup is secure after enabling. We will demonstrate how ClusterControl enables security on default installations. And we will discuss how to leverage the ClusterControl advisors and the MongoDB Audit Log to constantly scan your environment, and harden your security even more.
Date, Time & Registration
Europe/MEA/APAC
Tuesday, March 14th at 09:00 GMT / 10:00 CET (Germany, France, Sweden)
Art van Scheppingen is a Senior Support Engineer at Severalnines. He’s a pragmatic database expert with over 16 years experience in web development. He previously worked at Spil Games as Head of Database Engineering, where he kept a broad vision upon the whole database environment: from MySQL to MongoDB, Vertica to Hadoop and from Sphinx Search to SOLR. He regularly presents his work and projects at various conferences (Percona Live, MongoDB Open House, FOSDEM) and related meetups.
We look forward to “seeing” you there!
This session is based upon the experience we have securing MongoDB and implementing it for our database infrastructure management solution, ClusterControl. For more details, read through our ‘Become a MongoDB DBA’ blog series.
Database security is a broad subject that stretches from pre-emptive measurements to keeping unwanted visitors out. Even if you would be able to secure your MongoDB servers fully, you still would like to know if anyone has attempted to break into your system. And if they manage to breach your security and install the MongoDB ransom hack, you would need an audit trail for post-mortems or for taking new preventive measures. An audit log would enable you to keep track of anyone attempting to log in and see what they did in your system.
The MongoDB Enterprise version contains the ability to enable the audit log, but the community version lacks this functionality. Percona created their own audit logging functionality in their MongoDB derived Percona Server for MongoDB. The MongoDB and Percona approaches are different from each other and we will explain how to configure and use both of them.
MongoDB audit logging
The MongoDB audit log is easy to set up: to enable audit logging to a JSON file, simply add the following section to your config file and restart MongoDB:
MongoDB supports file, console and syslog as destinations. For file formats there are two options: JSON and BSON. In JSON the audit log lines look similar to this:
The configuration above would enable the audit log for each and every action by any user of your system. If you have high concurrency this would dramatically decrease the performance of your MongoDB cluster. Luckily enough, there is the option to filter events that are to be logged.
Filters for the audit logging can be placed on the type of query, the user/role querying or on the collection that is being queried. The documentation on audit logging at MongoDB is very broad and lengthy with many examples. We will give some of the most important examples below.
As you can see the filters can be quite flexible, and you would be able to filter the messages that you require for your audit trail.
Percona Server for MongoDB audit logging
The Percona Server for MongoDB audit logging is limited to JSON file. The majority of users will only log to JSON files, but it is unclear if Percona will add other logging facilities in the future.
Depending on the version of Percona Server for MongoDB, your configuration might be different. At the moment of writing, all versions have the following syntax:
As opposed to MongoDB logging everything, Percona chose to only log the important commands. Judging from the source of the Percona audit plugin, the following queries are supported: authentication, create/update/delete users, add/update/remove roles, create/drop database/index and most of the important admin commands.
Also the filtering of the Percona Server for MongoDB audit log doesn’t seem to follow the same standard as MongoDB has. It is quite unclear what the exact filter syntax and options are as the Percona documentation is very concise about it.
Enabling the auditlog without filtering would give you more than enough entries in your log file. From here you can narrow the filter down, as it follows the JSON syntax of the log entries.
To make it easier for yourself, it might be the best to feed the audit log into a log analysing framework. An ELK stack is an excellent environment to do your analysis in and it enables you to drill down to more detailed levels quite easily. Using a field mapper would even allow you to do the audit trail inside ELK.
As described in the introduction, we can use the audit log for various security purposes. The most obvious one is when you need it as a reference during a post-mortem. The MongoDB audit log provides a detailed overview of what exactly happened. The Percona audit log contains a little less information, but it should be sufficient for most post-mortems. Using the audit log for post-mortems is great, although we would rather have prevented the issue in the first place.
Another purpose for the audit log is to see trends happening and you could set traps on a certain audit log message. A good example would be to check the rate of (failed) authentication attempts and if this exceeds a certain threshold, act upon it. Depending on the situation, the action taken could differ. One actions could be to automatically block the ip address the requests are coming from, but in another case, you could consult with the user about why the password was forgotten. It really depends on the case and environment you are working in.
Another advanced pre-emptive measurement would be using MongoDB as a honeypot and leveraging the audit log to catch unwanted users. Just expose MongoDB and allow anyone to connect to your MongoDB server. Then use the audit log to detect what users will do if they are allowed to do things beyond their normal powers and block them if necessary. Most humans rather take the easy way than the hard way, so the honeypot could deflect an attack and the hacker will move on to the next target.
Conclusion
Apart from explaining how to set up the audit log for both MongoDB Enterprise and Percona Server for MongoDB, we also explained what you could potentially do with the logged data inside the audit log.
By default ClusterControl will not enable the audit log, but it is relatively easy to enable it cluster wide using our Config Manager. You could also enable it inside the configuration templates, prior to deploying a new cluster.