Having too large a (write) workload on a master is dangerous. If the master collapses and a failover happens to one of its slave nodes, the slave node could collapse under the write pressure as well. To mitigate this problem you can shard horizontally across more nodes.
Sharding increases the complexity of data storage though, and very often, it requires an overhaul of the application. In some cases, it may be impossible to make changes to an application. Luckily there is a simpler solution: functional sharding. With functional sharding you move a schema or table to another master, and thus alleviating the master from the workload of these schemas or tables.
In this Tips & Tricks post, we will explain how you can functionally shard your existing master, and offload some workload to another master using functional sharding. We will use ClusterControl, MySQL replication and ProxySQL to make this happen, and the total time taken should not be longer than 15 minutes in total. Mission impossible? :-)
The example database
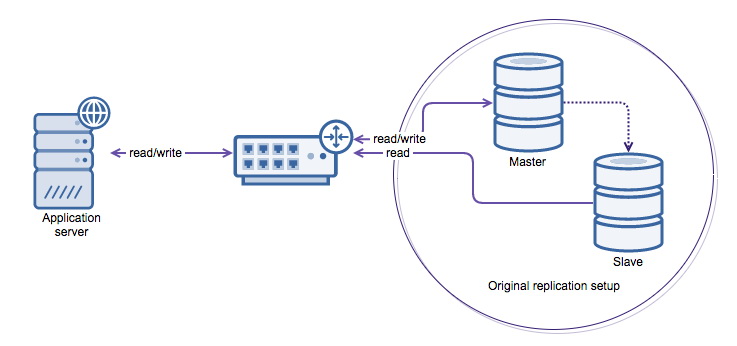
In our example we have a serious issue with the workload on our simple order database, accessed by the so_user. The majority of the writes are happening on two tables: orders and order_status_log. Every change to an order will write to both the order table and the status log table.
CREATE TABLE `orders` (
  `id` int(11) NOT NULL AUTO_INCREMENT,
  `customer_id` int(11) NOT NULL,
  `status` varchar(14) DEFAULT 'created',
  `total_vat` decimal(15,2) DEFAULT '0.00',
  `total` decimal(15,2) DEFAULT '0.00',
  `created` timestamp NOT NULL DEFAULT CURRENT_TIMESTAMP,
  `updated` timestamp NOT NULL DEFAULT CURRENT_TIMESTAMP ON UPDATE CURRENT_TIMESTAMP,
  PRIMARY KEY (`id`)
) ENGINE=InnoDB DEFAULT CHARSET=utf8;
CREATE TABLE `order_status_log` (
  `orderId` int(11) NOT NULL,
  `status` varchar(14) DEFAULT 'created',
  `changeTime` timestamp NOT NULL DEFAULT CURRENT_TIMESTAMP,
  `logline` text,
  PRIMARY KEY (`orderId`, `status`, `changeTime` )
) ENGINE=InnoDB DEFAULT CHARSET=utf8;
CREATE TABLE `customers` (
  `id` int(11) NOT NULL AUTO_INCREMENT,
  `firstname` varchar(15) NOT NULL,
  `surname` varchar(80) NOT NULL,
  `address` varchar(255) NOT NULL,
  `postalcode` varchar(6) NOT NULL,
  `city` varchar(50) NOT NULL,
  `state` varchar(50) NOT NULL,
  `country` varchar(50) NOT NULL,
  PRIMARY KEY (`id`)
) ENGINE=InnoDB DEFAULT CHARSET=utf8;
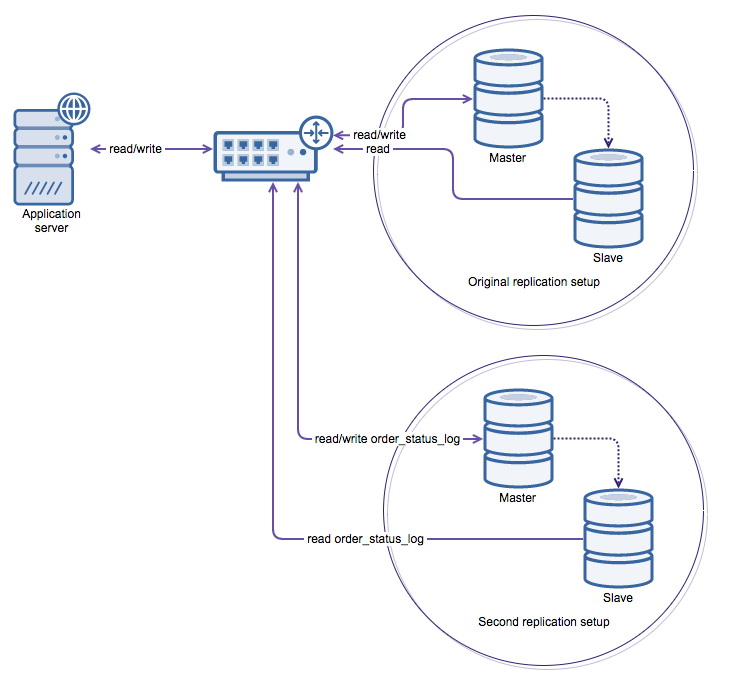
What we will do is to move the order_status_log table to another master.
As you might have noticed, there is no foreign key defined on the order_status_log table. This simply would not work across functional shards. Joining the order_status_log table with any other table would simply no longer work as it will be physically on a different server than the other tables. And if you write transactional data to multiple tables, the rollback will only work for one of these masters. If you wish to retain these things, you should consider to use homogenous sharding instead where you keep related data grouped together in the same shard.
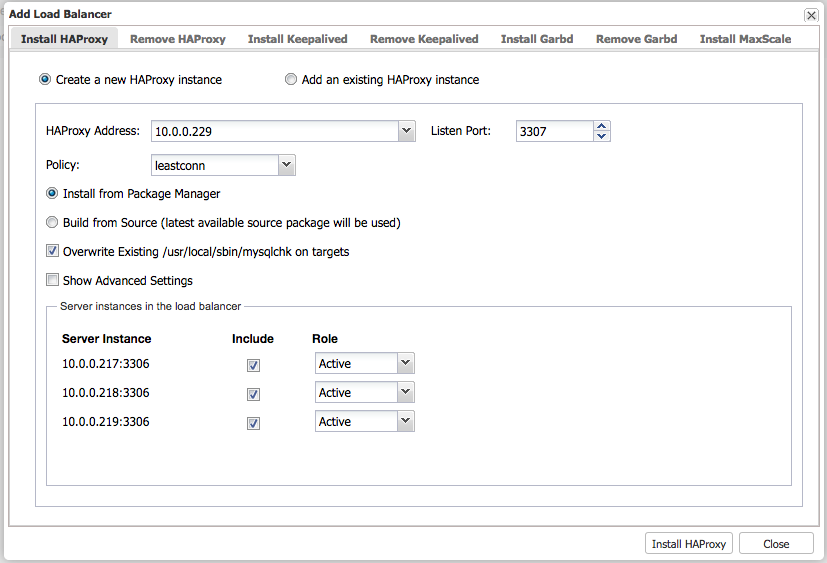
Installing the Replication setups
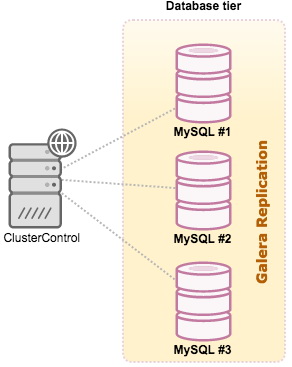
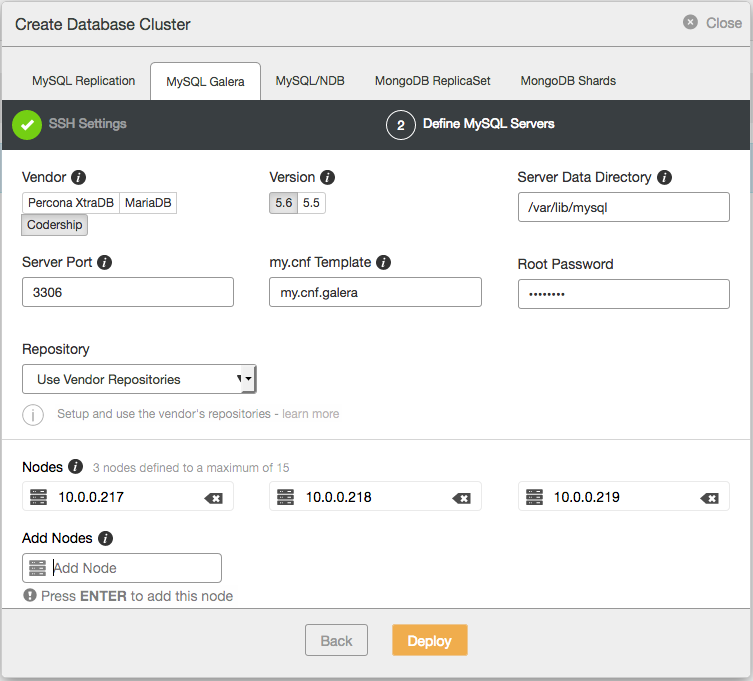
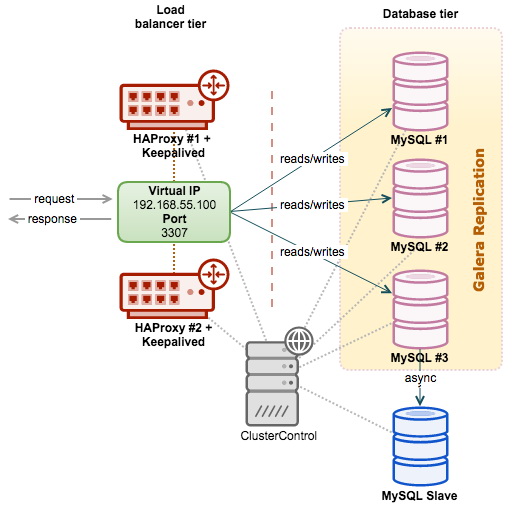
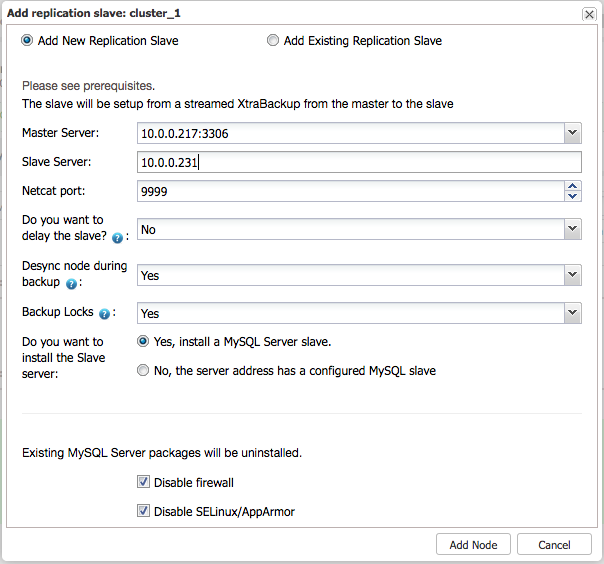
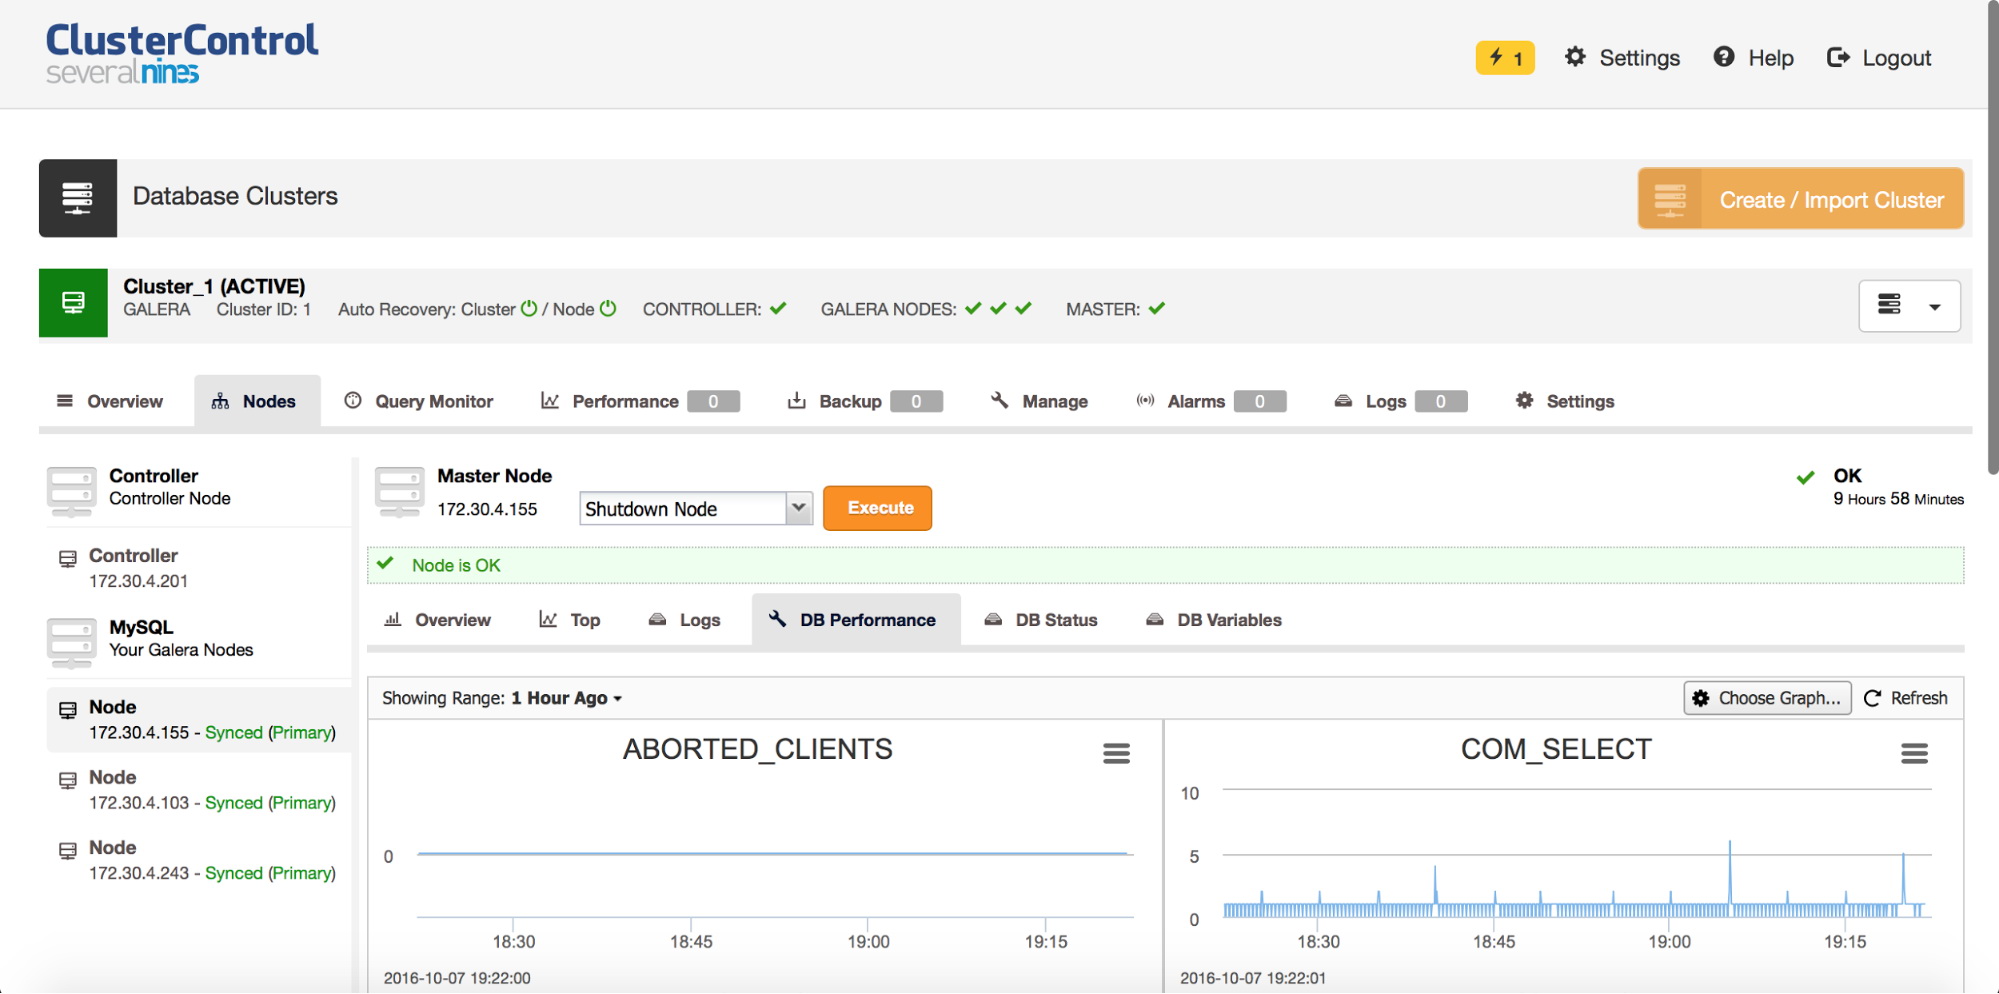
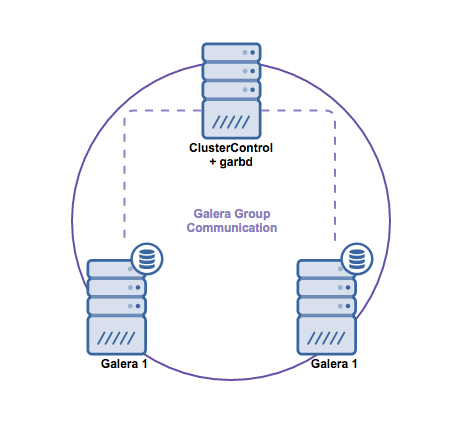
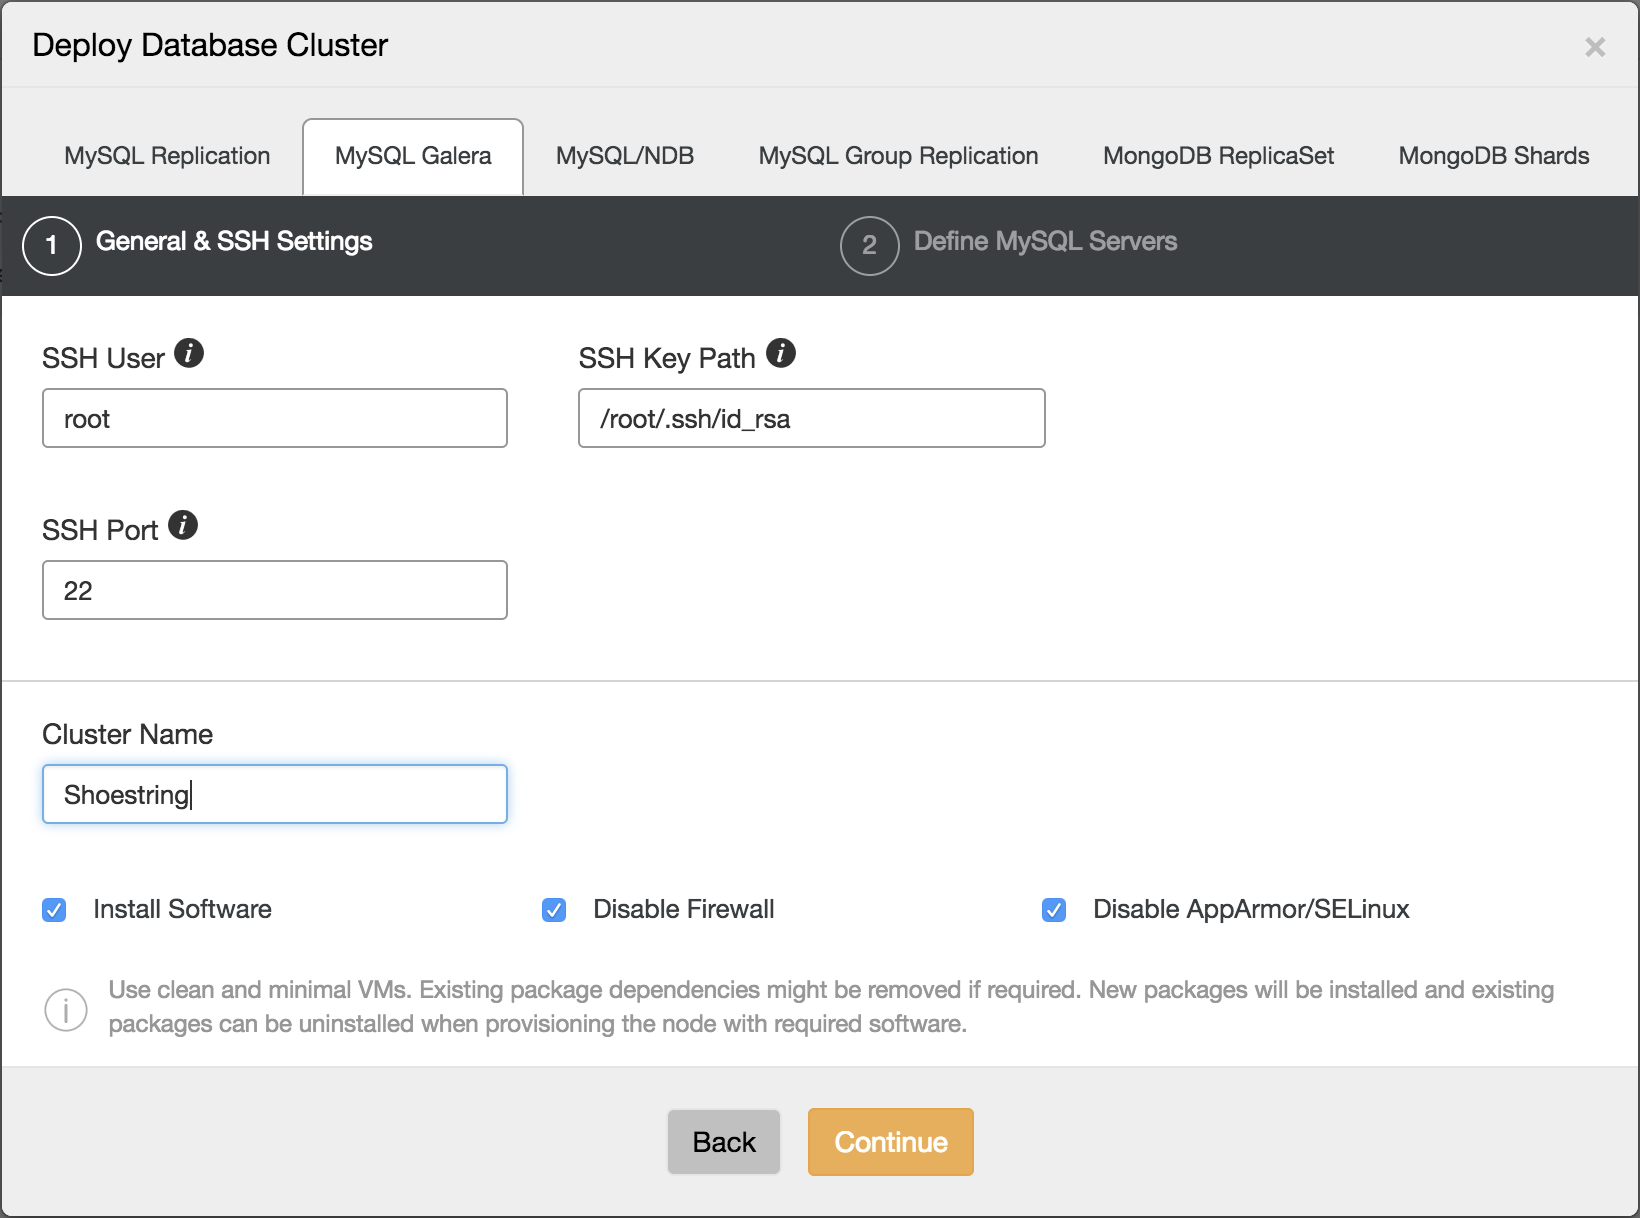
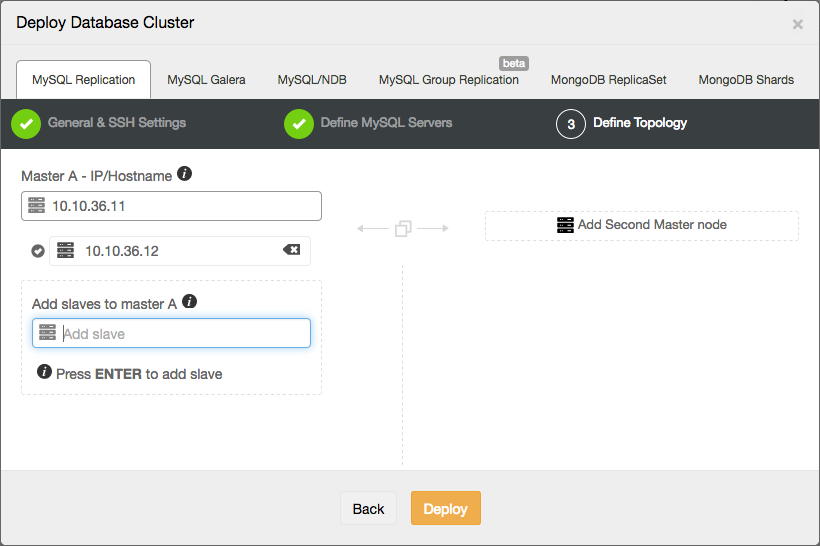
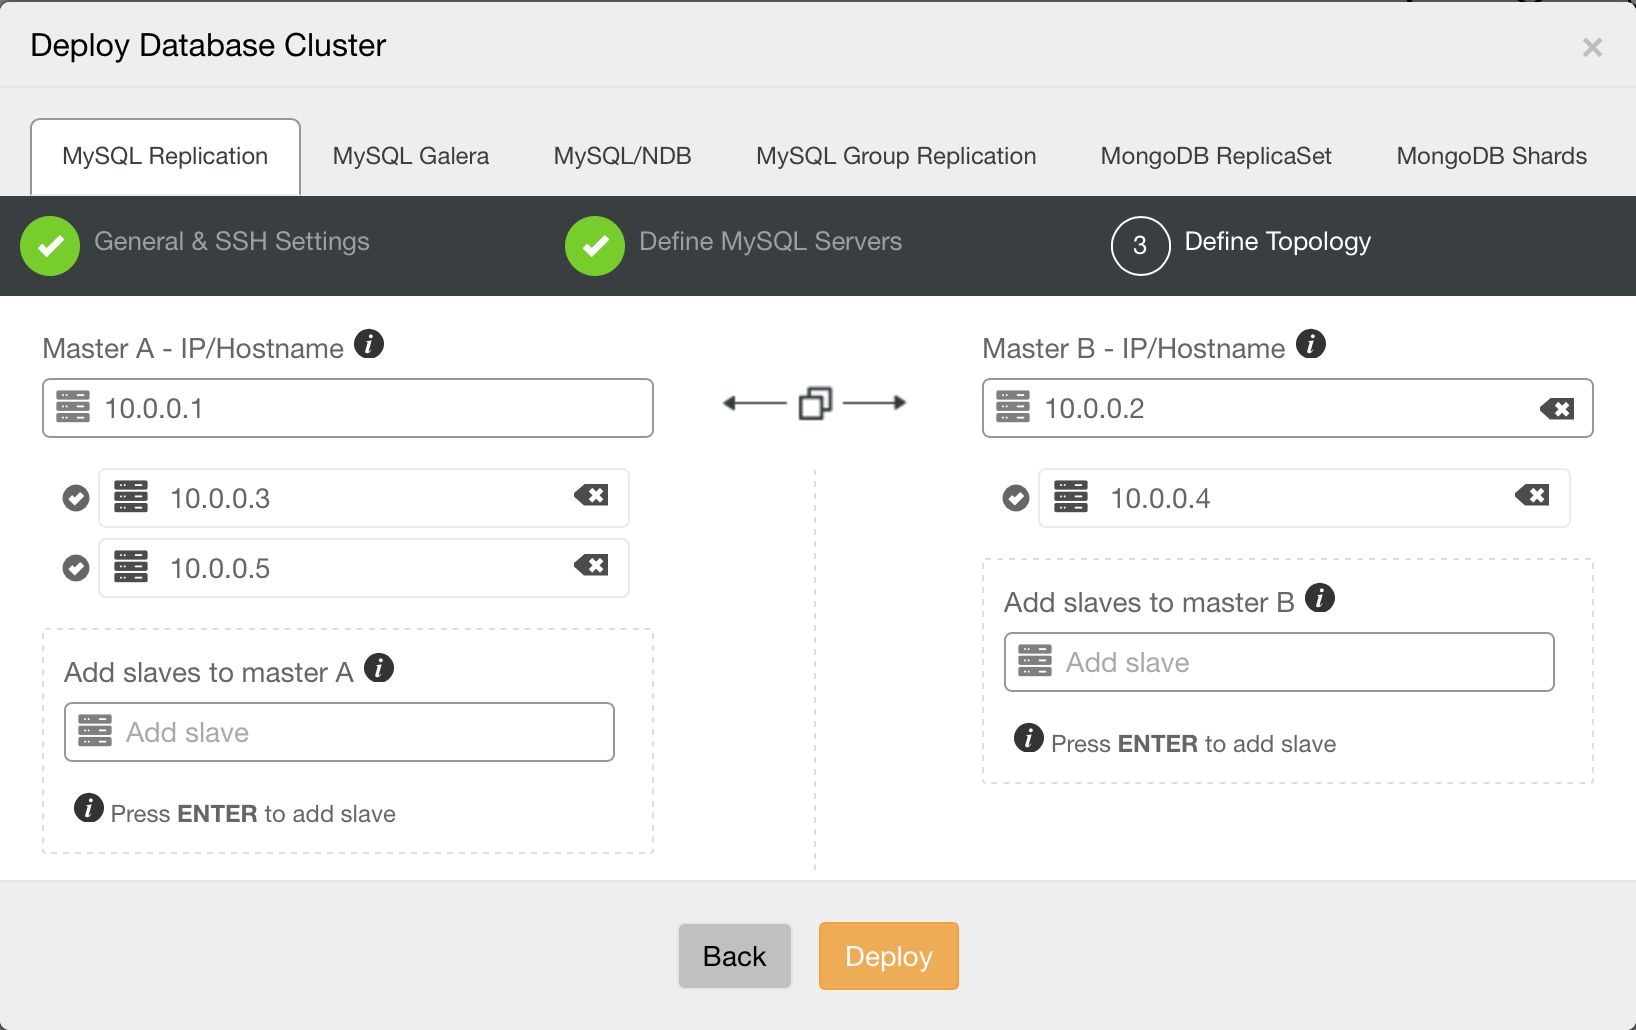
First, we will install a replication setup in ClusterControl. The topology in our example is really basic: we deploy one master and one replica:
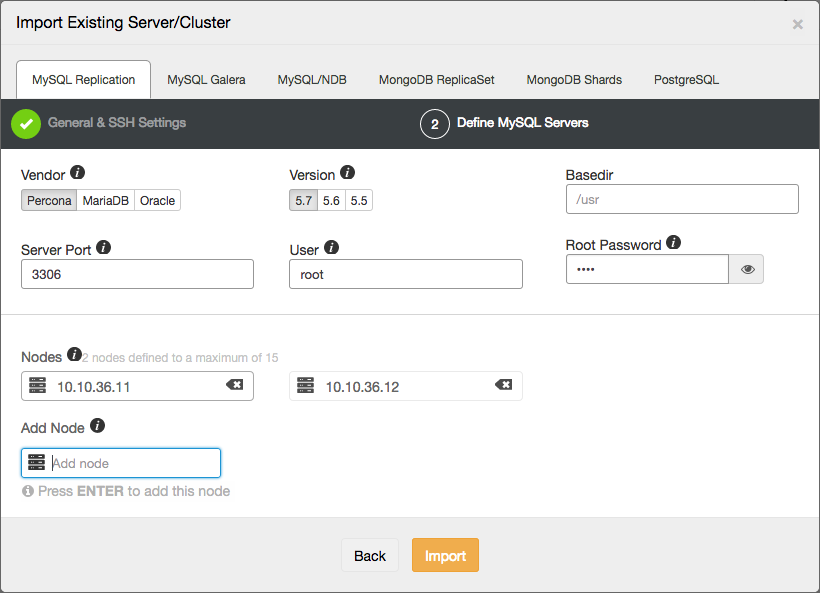
But you could import your own existing replication topology into ClusterControl as well.
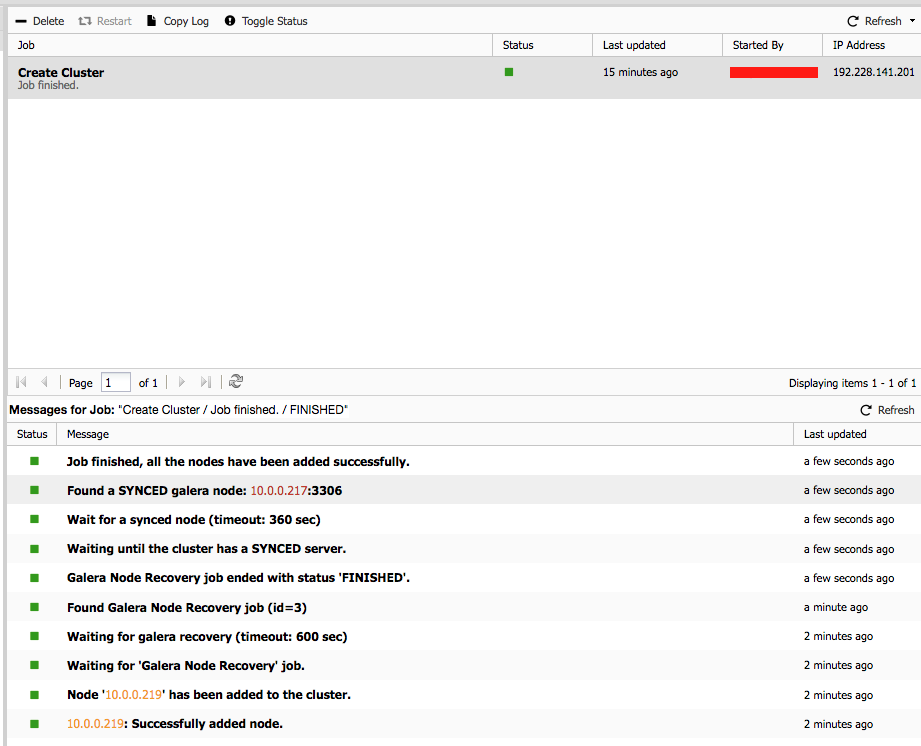
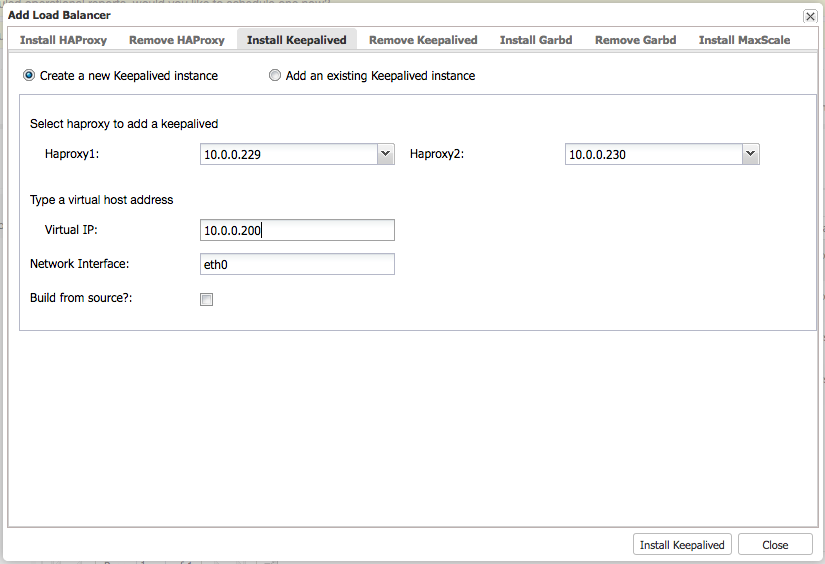
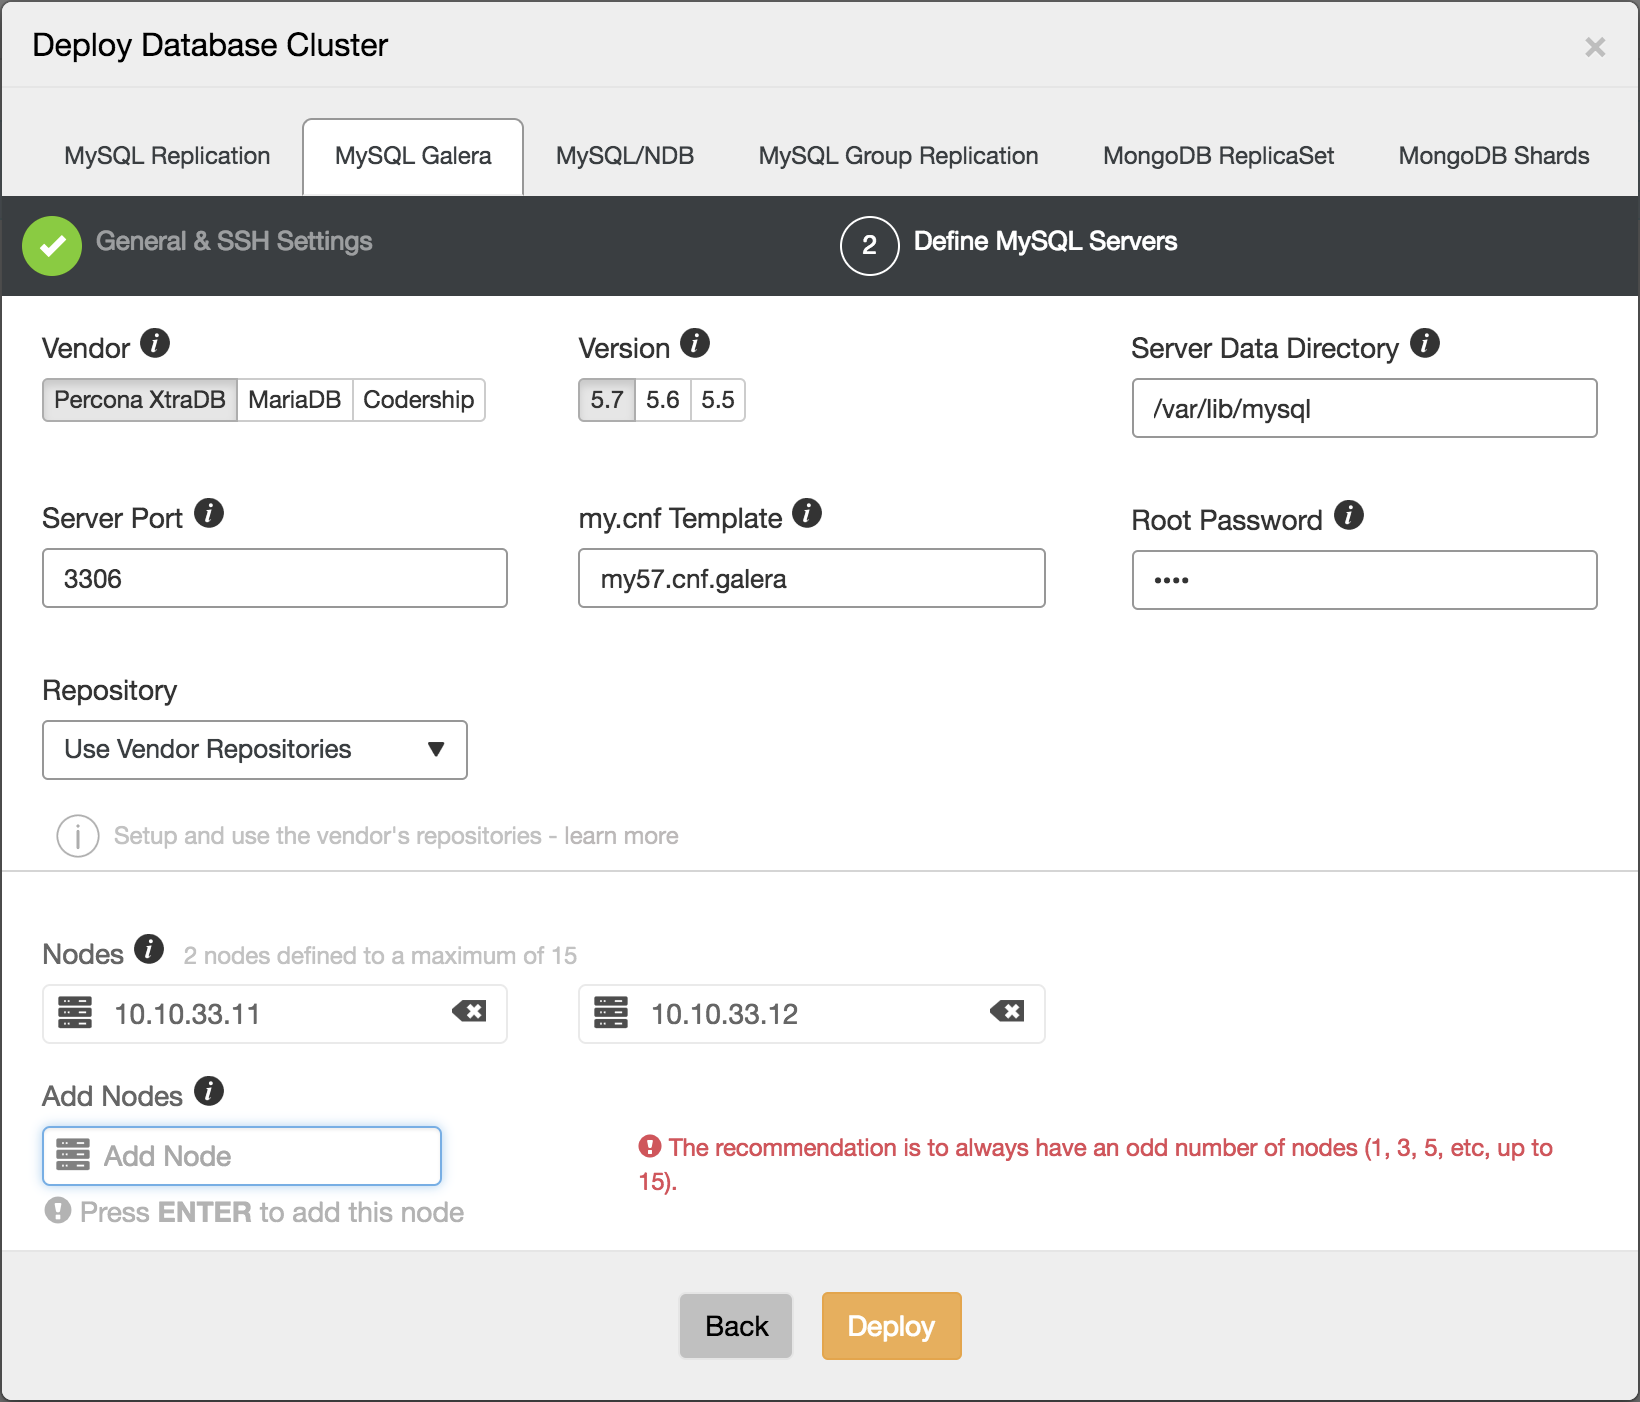
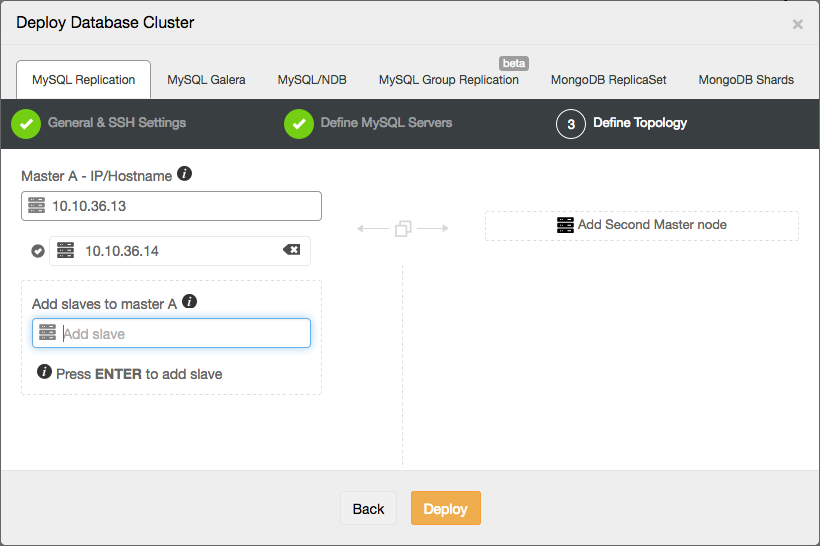
After the setup has been deployed, deploy the second setup:
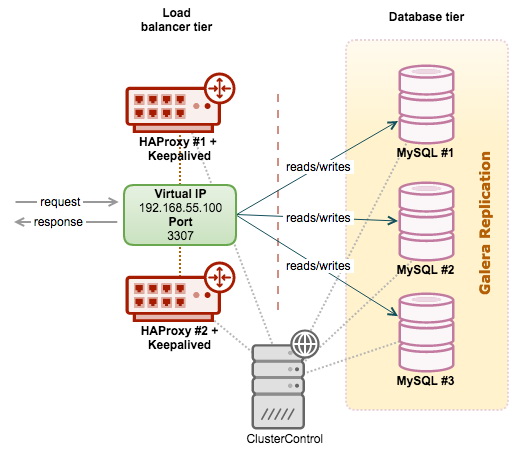
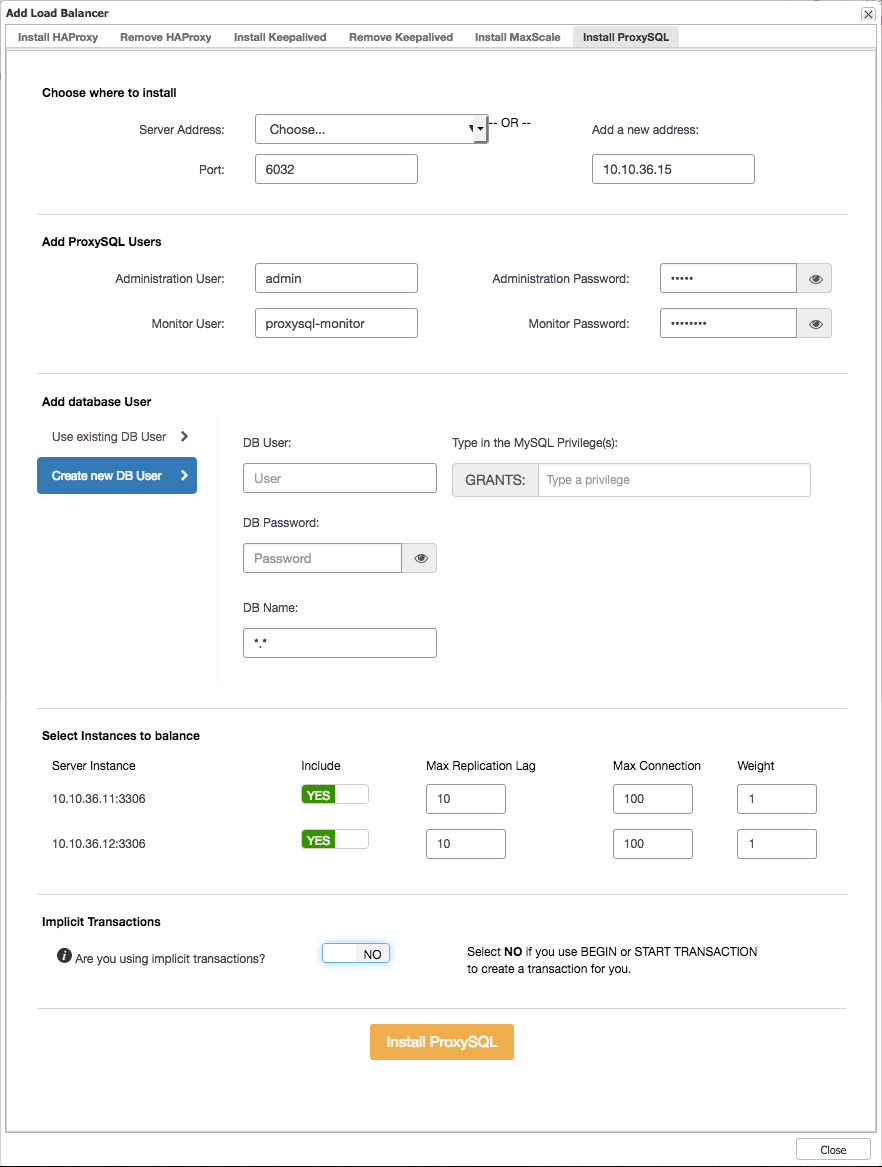
While waiting for the second setup to be deployed, we will add ProxySQL to the first replication setup:
Adding the second setup to ProxySQL
After ProxySQL has been deployed we can connect with it via command line, and see it’s current configured servers and settings:
MySQL [(none)]> select hostgroup_id, hostname, port, status, comment from mysql_servers;
+--------------+-------------+------+--------+-----------------------+
| hostgroup_id | hostname    | port | status | comment               |
+--------------+-------------+------+--------+-----------------------+
| 20           | 10.10.36.11 | 3306 | ONLINE | read server           |
| 20           | 10.10.36.12 | 3306 | ONLINE | read server           |
| 10           | 10.10.36.11 | 3306 | ONLINE | read and write server |
+--------------+-------------+------+--------+-----------------------+
MySQL [(none)]> select rule_id, active, username, schemaname, match_pattern, destination_hostgroup from mysql_query_rules;
+---------+--------+----------+------------+---------------------------------------------------------+-----------------------+
| rule_id | active | username | schemaname | match_pattern                                           | destination_hostgroup |
+---------+--------+----------+------------+---------------------------------------------------------+-----------------------+
| 100     | 1      | NULL     | NULL       | ^SELECT .* FOR UPDATE                                   | 10                    |
| 200     | 1      | NULL     | NULL       | ^SELECT .*                                              | 20                    |
| 300     | 1      | NULL     | NULL       | .*                                                      | 10                    |
+---------+--------+----------+------------+---------------------------------------------------------+-----------------------+
As you can see, ProxySQL has been configured with the ClusterControl default read/write splitter for our first cluster. Any basic select query will be routed to hostgroup 20 (read pool) while all other queries will be routed to hostgroup 10 (master). What is missing here is the information about the second cluster, so we will add the hosts of the second cluster first:
MySQL [(none)]> INSERT INTO mysql_servers VALUES (30, '10.10.36.13', 3306, 'ONLINE', 1, 0, 100, 10, 0, 0, 'Second repl setup read server'), (30, '10.10.36.14', 3306, 'ONLINE', 1, 0, 100, 10, 0, 0, 'Second repl setup read server');
Query OK, 2 rows affected (0.00 sec)
MySQL [(none)]> INSERT INTO mysql_servers VALUES (40, '10.10.36.13', 3306, 'ONLINE', 1, 0, 100, 10, 0, 0, 'Second repl setup read and write server');
Query OK, 1 row affected (0.00 sec)
After this we need to load the servers to ProxySQL runtime tables and store the configuration to disk:
MySQL [(none)]> LOAD MYSQL SERVERS TO RUNTIME;
Query OK, 0 rows affected (0.00 sec)
MySQL [(none)]> SAVE MYSQL SERVERS TO DISK;
Query OK, 0 rows affected (0.01 sec)
As ProxySQL is doing the authentication for the clients as well, we need to add the os_user user to ProxySQL to allow the application to connect through ProxySQL:
MySQL [(none)]> INSERT INTO mysql_users (username, password, active, default_hostgroup, default_schema) VALUES ('so_user', 'so_pass', 1, 10, 'simple_orders');
Query OK, 1 row affected (0.00 sec)
MySQL [(none)]> LOAD MYSQL USERS TO RUNTIME;
Query OK, 0 rows affected (0.00 sec)
MySQL [(none)]> SAVE MYSQL USERS TO DISK;
Query OK, 0 rows affected (0.00 sec)
Now we have added the second cluster and user to ProxySQL. Keep in mind that normally in ClusterControl the two clusters are considered two separate entities. ProxySQL will remain part of the first cluster. Even though it is now configured for the second cluster, it will only be displayed under the first cluster,.
Mirroring the data
Keep in mind that mirroring queries in ProxySQL is still a beta feature, and it doesn’t guarantee the mirrored queries will actually be executed. We have found it working fine within the boundaries of this use case. Also there are (better) alternatives to our example here, where you would make use of a restored backup on the new cluster and replicate from the master until you make the switch. We will describe this scenario in a follow up Tips & Tricks blog post.
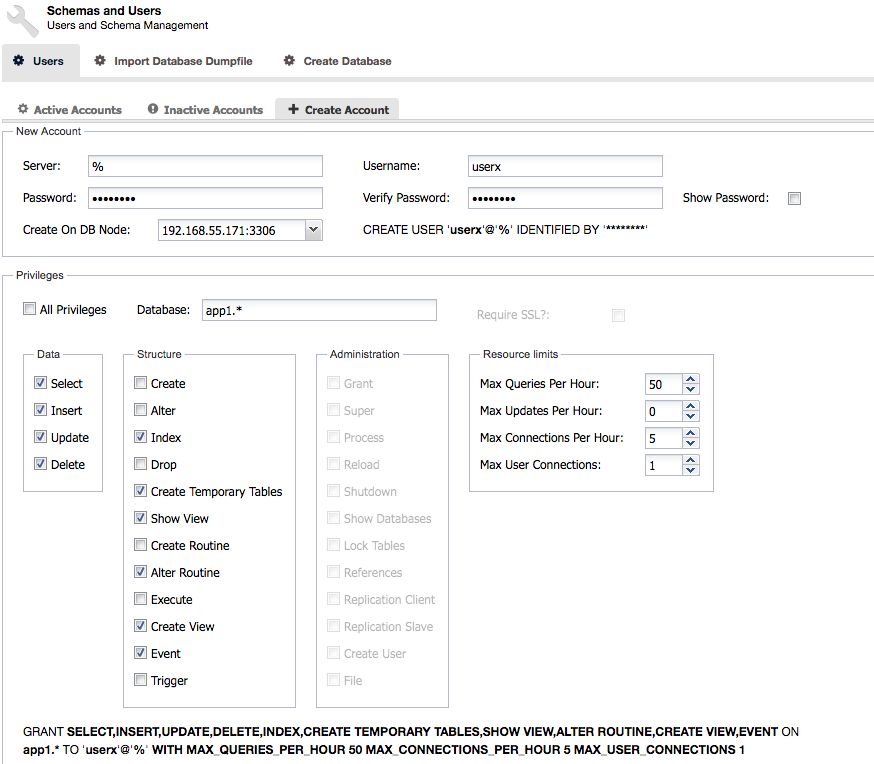
Now that we have added the second cluster, we need to create the simple_orders database, the order_status_log table and the appropriate users on the master of the second cluster:
mysql> create database simple_orders;
Query OK, 1 row affected (0.01 sec)
mysql> use simple_orders;
Database changed
mysql> CREATE TABLE `order_status_log` (
  `orderId` int(11) NOT NULL,
  `status` varchar(14) DEFAULT 'created',
  `changeTime` timestamp NOT NULL DEFAULT CURRENT_TIMESTAMP,
  `logline` text,
  PRIMARY KEY (`orderId`, `status`, `changeTime` )
) ENGINE=InnoDB DEFAULT CHARSET=utf8;
Query OK, 0 rows affected (0.00 sec)
mysql> create user 'so_user'@'10.10.36.15' identified by 'so_pass';
Query OK, 0 rows affected (0.00 sec)
mysql> grant select, update, delete, insert on simple_orders.* to 'so_user'@'10.10.36.15';
Query OK, 0 rows affected (0.00 sec)
This enables us to start mirroring the queries executed against the first cluster onto the second cluster. This requires an additional query rule to be defined in ProxySQL:
MySQL [(none)]> INSERT INTO mysql_query_rules (rule_id, active, username, schemaname, match_pattern, destination_hostgroup, mirror_hostgroup, apply) VALUES (50, 1, 'so_user', 'simple_orders', '(^INSERT INTO|^REPLACE INTO|^UPDATE|INTO TABLE) order_status_log', 20, 40, 1);
Query OK, 1 row affected (0.00 sec)
MySQL [(none)]> LOAD MYSQL QUERY RULES TO RUNTIME;
Query OK, 1 row affected (0.00 sec)
In this rule ProxySQL will match everything that is writing to the orders_status_log table, and send it in addition to the hostgroup 40. (write server of the second cluster)
Now that we have started mirroring the queries, the backfill of the data from the first cluster can take place. You can use the timestamp from the first entry in the new orders_status_log table to determine the time we started to mirror.
Once the data has been backfilled we can reconfigure ProxySQL to perform all actions on the orders_status_log table on the second cluster. This will be a two step approach: add a new rule to move the read queries to the second cluster’s read servers and except the SELECT … FOR UPDATE queries. Then another one to modify our mirroring query to stop mirroring and only write to the second cluster.
MySQL [(none)]> INSERT INTO mysql_query_rules (rule_id, active, username, schemaname, match_pattern, destination_hostgroup, apply) VALUES (70, 1, 'so_user', 'simple_orders', '^SELECT .* FROM order_status_log', 30, 1), (60, 1, 'so_user', 'simple_orders', '^FROM order_status_log .* FOR UPDATE', 40, 1);
Query OK, 2 rows affected (0.00 sec)
MySQL [(none)]> UPDATE mysql_query_rules SET destination_hostgroup=40, mirror_hostgroup=NULL WHERE rule_id=50;
Query OK, 1 row affected (0.00 sec)
And don’t forget to activate and persist the new query rules:
MySQL [(none)]> LOAD MYSQL QUERY RULES TO RUNTIME;
Query OK, 1 row affected (0.00 sec)
MySQL [(none)]> SAVE MYSQL QUERY RULES TO DISK;
Query OK, 0 rows affected (0.05 sec)
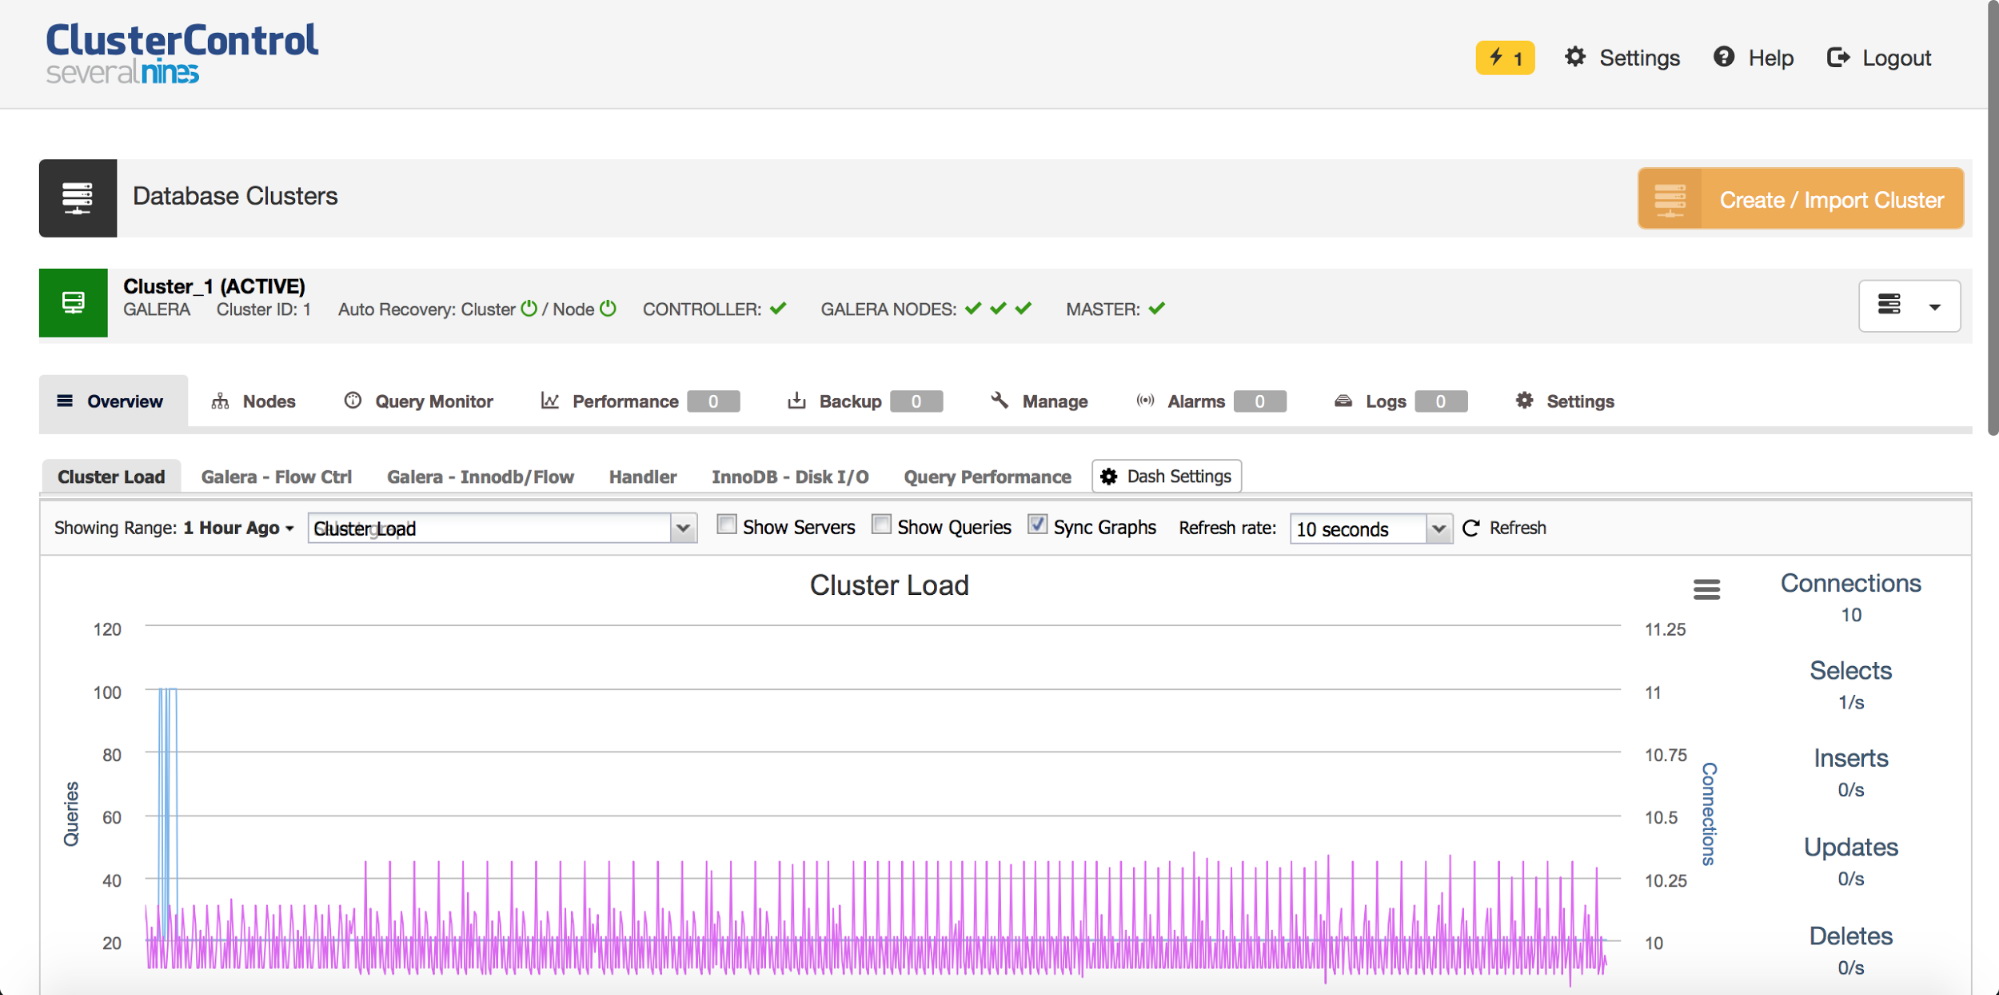
After this final step we should see the workload drop on the first cluster, and increase on the second cluster. Mission possible and accomplished. Happy clustering!