In the previous blog posts, we gave a brief introduction to the ClusterControl Developer Studio and the ClusterControl Domain Specific Language. We covered some useful examples, e.g., how to extract information from the Performance Schema and how to automatically have advisors scale your database clusters. ClusterControl Developer Studio allows you to write your own scripts, advisors and alerts. With just a few lines of code, you can already automate your clusters!
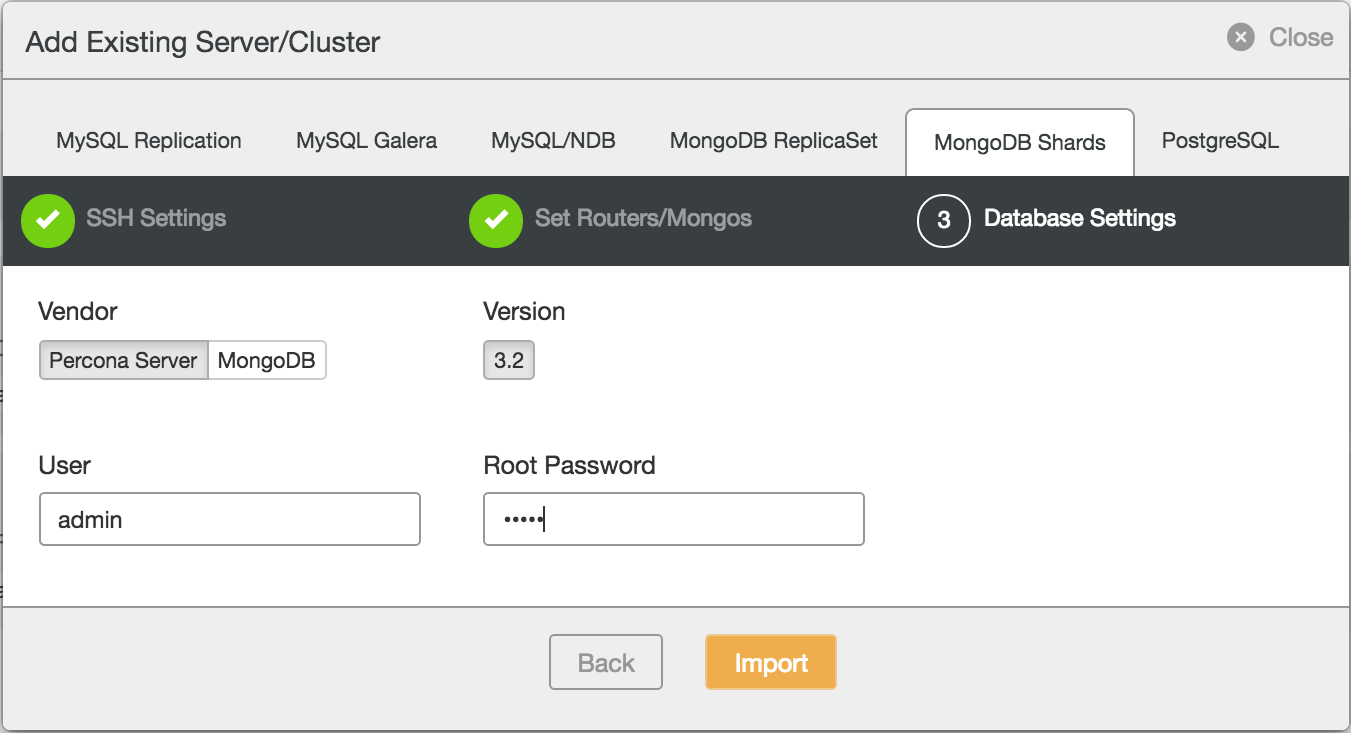
In this blog post, we will show you, step by step, how we implemented our MongoDB replication lag advisor in Developer Studio. We have included this advisor in ClusterControl 1.3.2, and enabled it by default on any MongoDB cluster or replicaSet.
MongoDB Replication lag
Why do we need advisors to warn us about replication lag? Imagine one of the secondary nodes in MongoDB is lagging behind for some unknown reason. This poses three risks:
- The MongoDB oplog is limited in size. If the node lags behind too far, it won’t be able to catch up. If this happens, a full sync will be issued and this is an expensive operation that has to be avoided at all times.
- Secondary nodes lagging behind are less likely to become primary after the primary node fails. A less favorable secondary node may be elected then.
- Secondary nodes lagging behind will less likely to be used for read requests offloading by the primary node. This increases the load on the primary.
As you can see, there are enough reasons to keep a close eye on the replication lag, to receive warnings on time and perform actions to prevent this from happening.
Calculating MongoDB Replication lag
To check the replication lag, it suffices to connect to the primary and retrieve this data using the replSetGetStatus command. In contrary to MySQL, the primary keeps track of the replication status of its secondaries.
A condensed version is seen below:
my_mongodb_0:PRIMARY> db.runCommand( { replSetGetStatus: 1 } )
{
…
    "members" : [
        {
            "_id" : 0,
            "name" : "10.10.32.11:27017",
            "stateStr" : "PRIMARY",
            "optime" : {
                "ts" : Timestamp(1466247801, 5),
                "t" : NumberLong(1)
            },
            "optimeDate" : ISODate("2016-06-18T11:03:21Z"),
        },
        {
            "_id" : 1,
            "name" : "10.10.32.12:27017",
            "stateStr" : "SECONDARY",
            "optime" : {
                "ts" : Timestamp(1466247801, 5),
                "t" : NumberLong(1)
            },
            "optimeDate" : ISODate("2016-06-18T11:03:21Z"),
        },
        {
            "_id" : 2,
            "name" : "10.10.32.13:27017",
            "stateStr" : "SECONDARY",
            "optime" : {
                "ts" : Timestamp(1466247801, 5),
                "t" : NumberLong(1)
            },
            "optimeDate" : ISODate("2016-06-18T11:03:21Z"),
        }
    ],
    "ok" : 1
}
You can calculate the lag by simply subtracting the secondary optimeDate (or optime timestamp) from the primary optimeDate. This will give you the replication lag in seconds.
Query the Primary Node
As described in the previous paragraph: we need to query the primary node to retrieve the replication status. So how would you query only the primary node in Developer Studio?
In Developer Studio, we have specific host types for MySQL, MongoDB and PostgreSQL. For a MongoDB host, you are able to perform a query against MongoDB on the host using the executeMongoQuery function.
First we iterate over all hosts in our cluster, and then check if the selected node is the master by issuing a MongoDB query that returns this state:
for (i = 0; i < hosts.size(); i++)
{
    // Find the master and execute the queries there
    host = hosts[i];
    res = host.executeMongoQuery("{isMaster: 1}");
    if (res["result"]["ismaster"] == true) {
…
Now that we have ensured we are on the primary node, we can query the host for the replication status:
res = host.executeMongoQuery("{ replSetGetStatus: 1 }");
This returns a map object that we can use to create a new array with the optime per host. Once we have found the master, we also keep a reference to the element in this array for later use:
for(o = 0; o < res["result"]["members"].size(); o++)
{
    node_status = res["result"]["members"][o];
    // Keep reference to the master host
    if (node_status["name"] == master_host)
    {
        optime_master = o;
    }
    optime_nodes[o] = {};
    optime_nodes[o]["name"] = node_status["name"];
    optime_nodes[o]["optime"] = node_status["optime"]["ts"]["$timestamp"]["t"];
}
Now it really has become easy to calculate the replication lag per host, and give advice if necessary:
// Check if any of the hosts is lagging
for(o = 0; o < optime_nodes.size(); o++)
{
replication_lag = optime_nodes[optime_master]["optime"] - optime_nodes[o]["optime"];
if(replication_lag > WARNING_LAG_SECONDS)
{
advice.setSeverity(Warning);
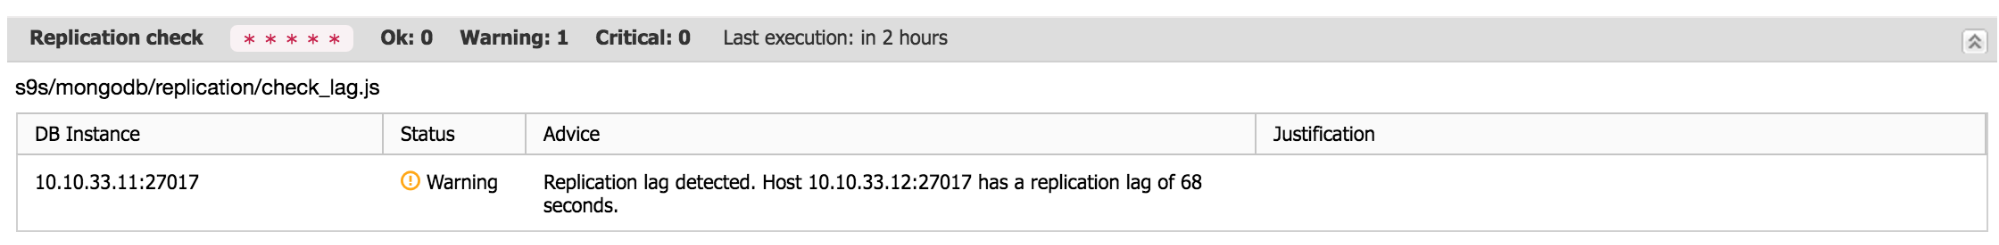
msg = ADVICE_WARNING + "Host " + optime_nodes[o]["name"] + " has a replication lag of " + replication_lag + " seconds.";
}
}
After scheduling the script the output will look similar to this in the advisor page:
Improvements
Naturally this check only advises for the pre-set replication lag. We can improve this advisor by also comparing the replication lag per host with the replication window inside the oplog. Once we have this metric inside ClusterControl, we will add this to the advisor.
Conclusion
With a very simple advisor, we are able to monitor the replication lag. Reasons for lagging can be network latency, disk throughput, concurrency and bulk loading. In the case of network latency, disk throughput and concurrency, you should be able to correlate these advisors with the respective graphs available in ClusterControl. For bulk loading, you would see this as an increase of writes in the ops counters.
The complete advisor
#include "common/helpers.js"
#include "cmon/io.h"
#include "cmon/alarms.h"

var WARNING_THRESHOLD=90;
var WARNING_LAG_SECONDS = 60;
var TITLE="Replication check";
var ADVICE_WARNING="Replication lag detected. ";
var ADVICE_OK="The replication is functioning fine." ;


function main(hostAndPort) {

    if (hostAndPort == #N/A)
        hostAndPort = "*";

    var hosts   = cluster::mongoNodes();
    var advisorMap = {};
    var result= [];
    var k = 0;
    var advice = new CmonAdvice();
    var msg = "";
    for (i = 0; i < hosts.size(); i++)
    {
        // Find the master and execute the queries there
        host = hosts[i];
        res = host.executeMongoQuery("{isMaster: 1}");
        if (res["result"]["ismaster"] == true) {
            master_host = host;
            optime_master = 0;
            optime_nodes = [];
            res = host.executeMongoQuery("{ replSetGetStatus: 1 }");
            // Fetch the optime per host
            for(o = 0; o < res["result"]["members"].size(); o++)
            {
                node_status = res["result"]["members"][o];
                // Keep reference to the master host
                if (node_status["name"] == master_host)
                {
                    optime_master = o;
                }
                optime_nodes[o] = {};
                optime_nodes[o]["name"] = node_status["name"];
                optime_nodes[o]["optime"] = node_status["optime"]["ts"]["$timestamp"]["t"];

            }
            msg = ADVICE_OK;
            // Check if any of the hosts is lagging
            for(o = 0; o < optime_nodes.size(); o++)
            {
                replication_lag = optime_nodes[optime_master]["optime"] - optime_nodes[o]["optime"];
                if(replication_lag > WARNING_LAG_SECONDS)
                {
                    advice.setSeverity(Warning);
                    msg = ADVICE_WARNING + "Host " + optime_nodes[o]["name"] + " has a replication lag of " + replication_lag + " seconds.";
                }
            }

            if (advice.severity() <= 0) {
                advice.setSeverity(Ok);
            }
        }
        advice.setHost(host);
        advice.setTitle(TITLE);
        advice.setAdvice(msg);
        advisorMap[i]= advice;
    }
    return advisorMap;
}