Many of our users speak highly of our product ClusterControl, especially how easy it is to install the software package. Installing new software is one thing, but using it properly is another.
We all are impatient to test new software and would rather like to toy around in a new exciting application than to read documentation up front. That is a bit unfortunate as you may miss the most important features or find out the way of doing things yourself instead of reading how to do things the easy way.
![]()
This new blog series will cover all the basic operations of ClusterControl for MySQL, MongoDB & PostgreSQL with examples explaining how to do this, how to make most of your setup and provides a deep dive per subject to save you time.
These are the topics we'll cover in this series:
- Deploying the first clusters
- Adding your existing infrastructure
- Performance and health monitoring
- Make your components HA
- Workflow management
- Safeguarding your data
- Protecting your data
- In depth use case
In today’s post we cover installing ClusterControl and deploying your first clusters.
Preparations
In this series we will make use of a set of Vagrant boxes but you can use your own infrastructure if you like. In case you do want to test it with Vagrant, we made an example setup available from the following Github repository:
https://github.com/severalnines/vagrant
Clone the repo to your own machine:
git clone git@github.com:severalnines/vagrant.gitThe topology of the vagrant nodes is as follows:
- vm1: clustercontrol
- vm2: database node1
- vm3: database node2
- vm4: database node3
Obviously you can easily add additional nodes if you like by changing the following line:
4.times do |n|The Vagrant file is configured to automatically install ClusterControl on the first node and forward the user interface of ClusterControl to port 8080 on your hos that runs Vagrantt. So if your host’s ip address is 192.168.1.10 you find ClusterControl UI here: http://192.168.1.10:8080/clustercontrol/
Installing ClusterControl
You can skip this if you chose to use the Vagrant file and received the automatic installation for free. But installation of ClusterControl is easy and will take less than five minutes of your time.
With the package installation all you have to do is issue the following three commands on the ClusterControl node to get it installed:
$ wget http://www.severalnines.com/downloads/cmon/install-cc
$ chmod +x install-cc
$ ./install-cc   # as root or sudo user
That’s it: it can’t get easier than this. If the installation script did not encounter any issues ClusterControl has been installed and is up and running. You can now log into ClusterControl on the following URL:
http://192.168.1.210/clustercontrol
After creating an administrator account and logging in, you will be prompted to add your first cluster.
Deploy a Galera cluster
In case you have installed ClusterControl via the package installation or when there are no clusters defined in ClusterControl you will be prompted to create a new database server/cluster or add an existing (i.e., already deployed) server or cluster:

In this case we are going to deploy a Galera cluster and this only requires one screen to fill in:

To allow ClusterControl to install the Galera nodes we use the root user that was granted ssh access by the Vagrant bootstrap scripts. In case you chose to use your own infrastructure, you must enter a user here that is allowed to do passwordless ssh to the nodes that ClusterControl is going to control.
Also make sure you disable AppArmor/SELinux. See here why.
After filling in all the details and you have clicked Deploy, a job will be spawned to build the new cluster. The nice thing is that you can keep track of the progress of this job by clicking on the spinning circle between the messages and settings icon in the top menu bar:

Clicking on this icon will open a popup that keeps you updated on the progress of your job.


Once the job has finished, you have just created your first cluster. Opening the cluster overview should look like this:

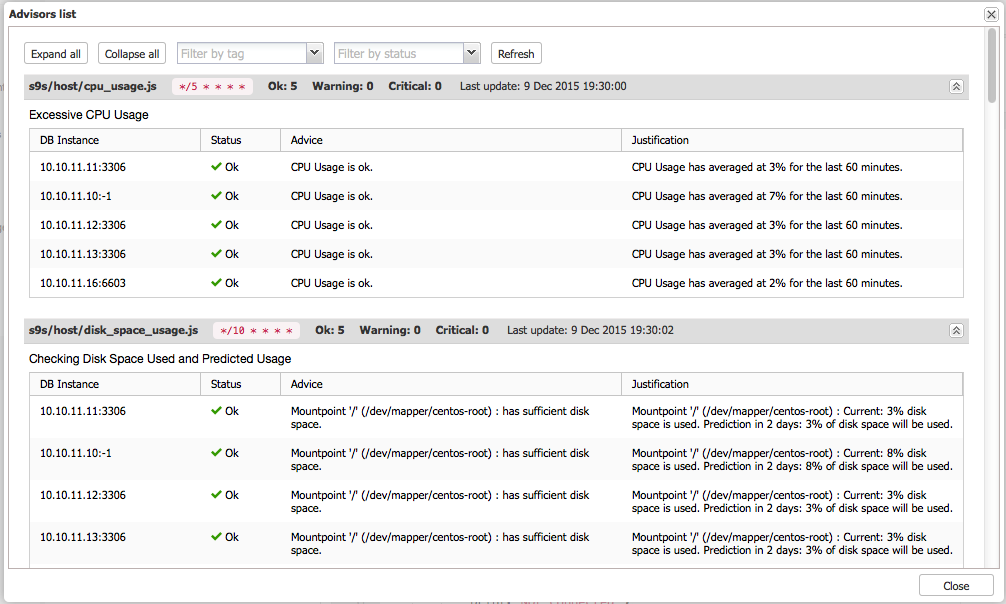
In the nodes tab, you can do about any operation you normally would like to do on a cluster and more. The query monitor gives you a good overview of both running and top queries. The performance tab will help you to keep a close eye upon the performance of your cluster and also features the advisors that help you to act pro-actively on trends in data. The backups tab enables you to easily schedule backups that are either stored on the DB nodes or the controller host and the managing tab enables you to expand your cluster or make it highly available for your applications through a load balancer.
All this functionality will be covered in later blog posts in this series.
Deploy a MySQL replication set
A new feature in ClusterControl 1.2.11 is that you can not only add slaves to existing clusters/nodes but you can also create new masters. In order to create a new replication set, the first step would be creating a new MySQL master:

After the master has been created you can now deploy a MySQL slave via the “Add Node” option in the cluster list:

Keep in mind that adding a slave to a master requires the master’s configuration to be stored in the ClusterControl repository. This will happen automatically but will take a minute to be imported and storedAfter adding the slave node, ClusterControl will provision the slave with a copy of the data from its master using Xtrabackup. Depending on the size of your data this may take a while.
Deploy a PostgreSQL replication set
Creating a PostgreSQL cluster requires one extra step as compared to creating a Galera cluster as it gets divided in adding a standalone PostgreSQL server and then adding a slave. The two step approach lets you decide which server will become the master and which one becomes the slave.
A side note is that the supported PostgreSQL version is 9.x and higher. Make sure the correct version gets installed by adding the correct repositories by PostgreSQL: http://www.postgresql.org/download/linux/
First we create a master by deploying a standalone PostgreSQL server:

After deploying, the first node will become available in the cluster list as a single node instance.
You can either open the cluster overview and then add the slave, but the cluster list also gives you the option to immediately add a replication slave to this cluster:

And adding a slave is as simple as selecting the master and filling in the fqdn for the new slave:

The PostgreSQL cluster overview gives you a good insight in your cluster:

Just like with the Galera and MySQL cluster overviews you can find all the necessary tabs and functions here: the query monitor, performance, backups tabs enables you to do the necessary operations.
Deploy a MongoDB replicaSet
Deploying a new MongoDB replicaSet is similar to PostgreSQL. First we create a new master node:

After installing the master we can add a slave to the replicaSet using the same dropdown from the cluster overview:

Keep in mind that you need to select the saved Mongo template here to start replicating from a replicaSet, in this case select the mongod.conf.shardsvr configuration.

After adding the slave to the MongoDB replicaSet, a job will be spawned. Once this job has finished it will take a short while before MongoDB adds it to the cluster and it becomes visible in the cluster overview.

Similar to the PostgreSQL, Galera and MySQL cluster overviews you can find all the necessary tabs and functions here: the query monitor, performance, backups tabs enables you to do the necessary operations.
Final thoughts
With these three examples we have shown you how easy it is to set up new clusters for MySQL, MongoDB and PostgreSQL from scratch in only a couple of minutes. The beauty of using this Vagrant setup is that you can as easy as spawning this environment also take it down again and then spawn again. Impress your fellow colleagues on how easily you can setup a working environment and convince them to use it as their own test or devops environment.
Of course it would be equally interesting to add existing hosts and clusters into ClusterControl and that’s what we'll cover next time.
Blog category: